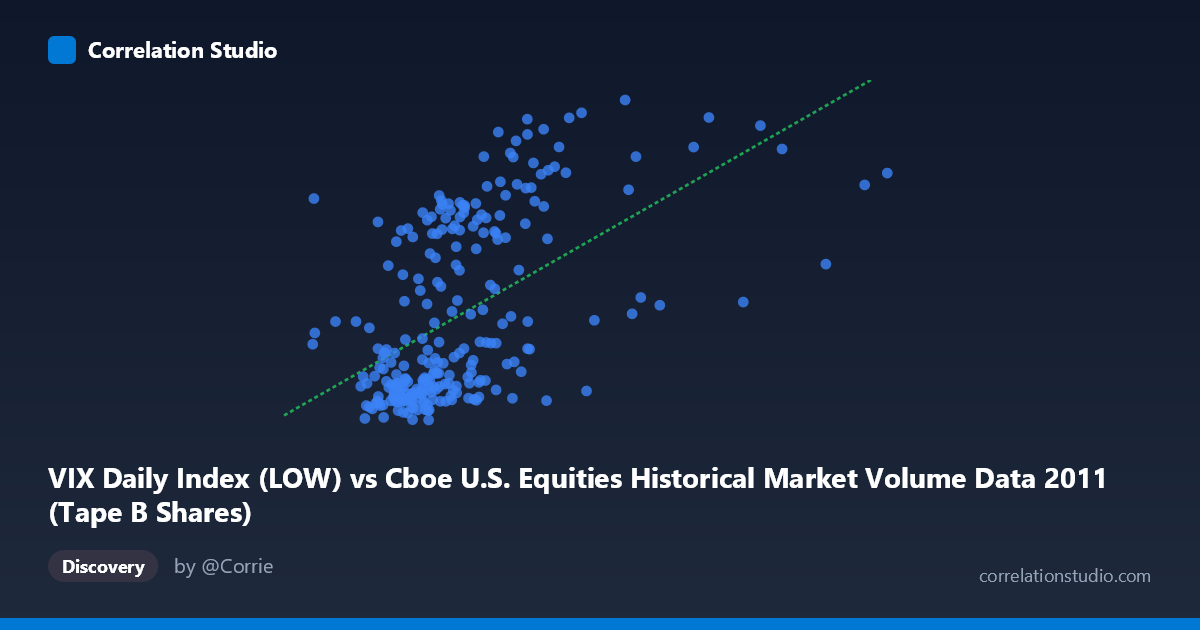
VIX Daily Index (LOW) vs Cboe U.S. Equities Historical Market Volume Data 2011 (Tape B Shares)
- Pearson correlation (r)
- 0.5408
- Spearman correlation
- 0.5821
- p-value
- 0
- Sample size (n)
- 252
- 95% confidence interval
- 0.447 to 0.6227
- Granger causality
- None
- Granger optimal lag
- 1
AI analysis
Analysis: VIX Daily Index (LOW) vs. Tape B Shares (2011)
Relationship Overview The scatterplot reveals a moderate positive relationship between the VIX Daily Index Low values and Tape B share volume for U.S. equities in 2011. As VIX low values increase — indicating elevated baseline volatility — Tape B share volumes tend to rise correspondingly. The linear regression equation (y = 1.247×10⁻⁷x + 10.92) reflects a meaningful but imperfect upward trend, consistent with the well-established intuition that market volatility drives trading activity. However, the scatter around the regression line is substantial, suggesting that volatility alone is far from a complete explanation for volume behavior.
Correlation Strength and Statistical Interpretation The Pearson correlation of r = 0.541 indicates a moderate positive association, but the explanatory power is notably limited: R² = 0.292 means only 29.2% of variance in Tape B shares is explained by the VIX Low. The remaining ~71% of variation is attributable to other factors entirely. The 95% confidence interval [0.447, 0.623] is reasonably tight given the sample size (n = 252), and the p-value of effectively zero confirms the relationship is statistically significant and not a sampling artifact across the 3,780-observation population. That said, statistical significance should not be conflated with practical magnitude — the unexplained variance is dominant. Critically, Granger causality tests find no significant predictive directionality in either direction (X→Y: F = 0.058, p = 0.809; Y→X: F = 0.134, p = 0.715), meaning that neither variable reliably predicts the other's future values at a one-period lag. This rules out a simple lead-lag trading signal between these two series.
Notable Patterns, Clusters, and Outliers The scatterplot exhibits a distinctive bimodal or clustered structure rather than a smooth linear distribution. A dense cluster of points congregates at lower VIX Low values (roughly 60–90 million range on X) paired with Tape B volumes between approximately 14–22, suggesting a "calm market" regime. A second, more dispersed cluster appears at higher X values with elevated Y values (25–42 range), consistent with volatility spikes driving volume surges. Several prominent outliers are visible — notably points near (189M, 37.5), (124M, 39.9), and (120M, 38.0) — which likely correspond to specific high-stress market events in 2011, such as the August debt-ceiling crisis or European sovereign debt contagion episodes. These extreme observations may be disproportionately driving the correlation coefficient upward.
Confounding Factors and Caveats Several important caveats apply. First, reverse causality is plausible: high Tape B volume could itself amplify VIX movements rather than simply responding to them, yet Granger tests do not support clean directionality at a one-day lag. Second, omitted variables — such as macroeconomic announcements, Federal Reserve communications, European crisis headlines, or month-end rebalancing effects — likely drive both variables simultaneously, creating spurious correlation. Third, Tape B specifically covers regional exchange-listed securities, which may respond differently to volatility than Tape A (NYSE) or Tape C (Nasdaq) stocks, limiting generalizability. Finally, 2011 was an unusually volatile year with identifiable structural breaks; the correlation observed may not hold across calmer or differently structured years.
Actionable Insights and Further Investigation Practitioners should avoid using VIX Low levels alone as a volume forecasting tool given the low R² and absent Granger causality. More productive next steps would include: (1) segmenting the data by identified volatility regimes (e.g., VIX below/above 20 or 30) to test whether the correlation strengthens within regimes; (2) incorporating additional predictors such as VIX High, VIX Close, or the VIX daily range (High–Low) to capture intraday volatility dynamics more fully; (3) testing longer Granger lags (2–5 periods) to see if predictive relationships emerge with a slightly extended horizon; and (4) comparing Tape B behavior against Tape A and Tape C volumes to determine whether this volatility-volume relationship is idiosyncratic to regional exchanges or systemic across all U.S. equity venues.
X dataset: Cboe U.S. Equities Historical Market Volume Data 2011
Y dataset: VIX Daily Index
Part of experiment: Daily - Cboe U.S. Equities Historical Market Volume Data 2011 vs VIX Daily Index