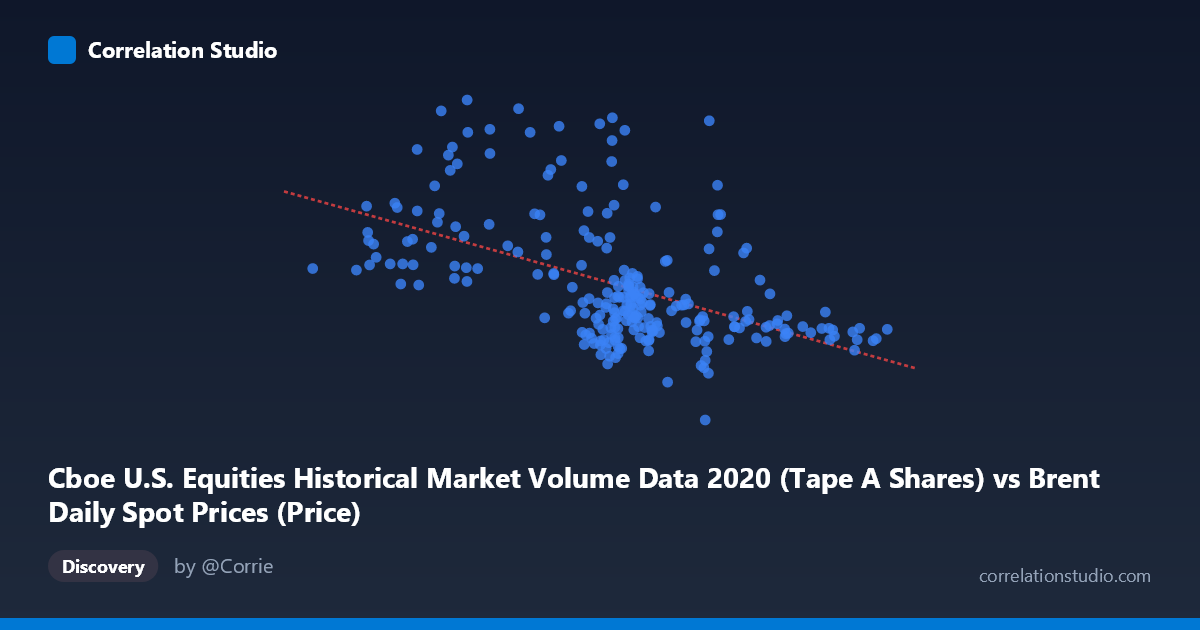
Cboe U.S. Equities Historical Market Volume Data 2020 (Tape A Shares) vs Brent Daily Spot Prices (Price)
- Pearson correlation (r)
- -0.5123
- Spearman correlation
- -0.5294
- p-value
- 0
- Sample size (n)
- 250
- 95% confidence interval
- -0.5983 to -0.4146
- Granger causality
- None
- Granger optimal lag
- 10
AI analysis
Scatterplot Analysis: Brent Crude Oil Prices vs. Cboe U.S. Equity Market Volume (2020)
Relationship Overview
The scatterplot reveals a moderate negative relationship between Brent crude oil spot prices (USD/barrel) and Cboe U.S. equity market volume (shares traded). As oil prices increase, equity trading volume tends to decrease, and vice versa. The linear regression equation (y = -3,838,640x + 455,806,000) quantifies this inverse relationship: each additional dollar per barrel in oil price is associated with approximately 3.84 million fewer shares traded. This pattern is visually consistent with the broader narrative of 2020, where the COVID-19-driven oil price collapse coincided with historic spikes in equity market activity, particularly during the March 2020 market turmoil when oil prices cratered and equity volumes surged dramatically.
Correlation Strength and Statistical Significance
The Pearson correlation of r = -0.51 indicates a moderate negative association, but the explanatory power is notably limited — R² = 0.2624 means only 26.2% of the variance in equity volume is explained by oil prices, leaving nearly three-quarters of volume variability unexplained by this single variable. The 95% confidence interval of [-0.598, -0.415] is entirely negative and does not cross zero, and the p-value of effectively 0 (against N = 4,254) confirms this relationship is statistically significant and not attributable to chance. However, statistical significance here is partly a function of the large population size, which makes even modest correlations highly significant. Critically, the Granger causality tests fail in both directions (X→Y: F = 0.66, p = 0.76; Y→X: F = 0.52, p = 0.87), meaning neither variable reliably predicts the other temporally at the optimal 10-period lag — the correlation reflects co-movement rather than any predictive or causal temporal mechanism.
Notable Patterns, Clusters, and Outliers
Several features stand out in the sample data. There is a visible cluster of high-volume observations (400M shares) concentrated at low oil prices (roughly 15–28 USD/barrel), consistent with the extreme March–April 2020 volatility period when oil briefly went negative and equity markets experienced panic trading. Conversely, observations at higher oil prices (55–70 USD/barrel) cluster tightly at relatively lower volumes (175–250M shares), suggesting a more stable, lower-activity regime. A number of outliers are apparent at mid-range oil prices (40–43 USD/barrel) that show highly variable volume (from ~180M to over 520M shares), indicating that at moderate oil price levels, other factors dominate volume behavior entirely. This heteroscedasticity — wider volume spread at lower oil prices — suggests the linear model is a rough approximation at best.
Confounding Factors and Interpretive Caveats
The most significant caveat is that 2020 was an extraordinary year dominated by a single confounding force: the COVID-19 pandemic. Both the oil price collapse and the equity volume surge were simultaneous consequences of the same exogenous shock, making this correlation largely spurious or at minimum heavily mediated by a third variable. The relationship likely does not reflect a structural economic mechanism between oil prices and equity volumes under normal conditions. Additional confounders include Federal Reserve emergency interventions, fiscal stimulus announcements, the OPEC+ price war, retail investor participation surges (Robinhood effect), and VIX-driven volatility trading. The dataset covers only a single calendar year, limiting generalizability, and the Granger non-causality result reinforces that this is a coincidental co-movement pattern rather than a meaningful predictive relationship.
Actionable Insights and Further Investigation
Despite the limitations, several investigative directions are worthwhile. Researchers should test whether this negative correlation persists in non-crisis years (e.g., 2017–2019) to determine if 2020 is genuinely anomalous. Incorporating VIX (volatility index) as a mediating variable would likely absorb much of the apparent oil-volume relationship, clarifying whether oil prices carry any independent explanatory power. A regime-switching or segmented regression analysis could formally separate the low-oil/high-volume crisis period from the recovery period, potentially revealing near-zero correlation within each regime. Additionally, sector-specific volume analysis (e.g., energy stocks vs. tech stocks) might reveal more nuanced directional relationships between oil prices and trading activity. Finally, extending the Granger causality test with shorter lag windows (1–3 trading days) around identified volatility events could uncover short-horizon predictive signals obscured in the aggregate annual analysis.
X dataset: Brent Daily Spot Prices
Y dataset: Cboe U.S. Equities Historical Market Volume Data 2020
Part of experiment: Daily - Brent Daily Spot Prices vs Cboe U.S. Equities Historical Market Volume Data 2020