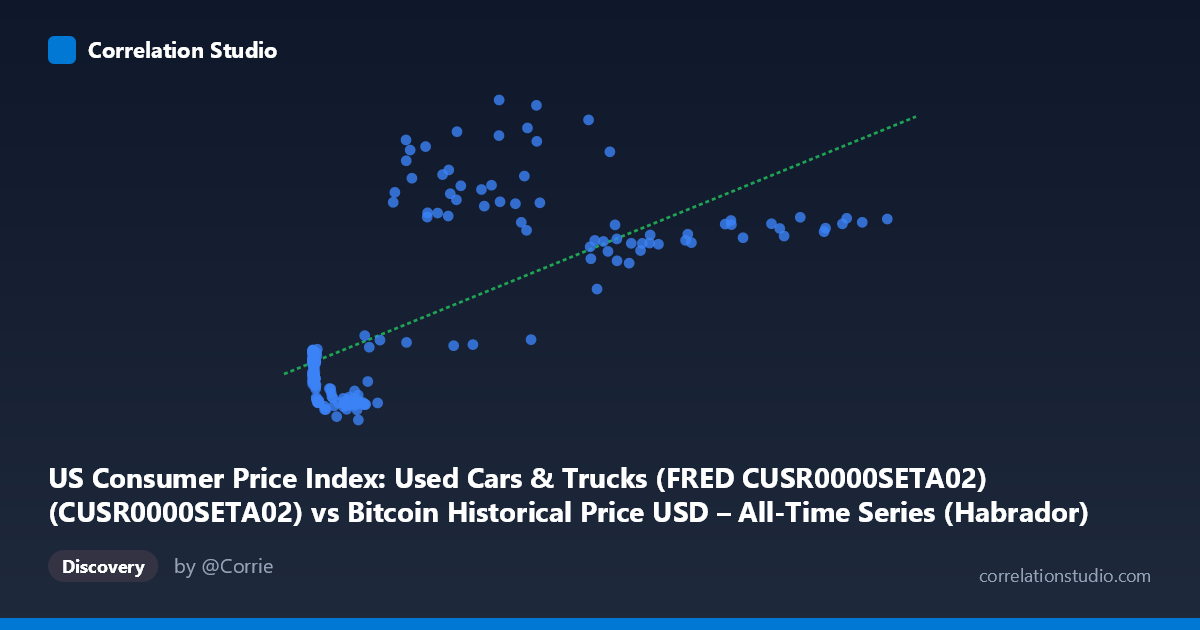
US Consumer Price Index: Used Cars & Trucks (FRED CUSR0000SETA02) (CUSR0000SETA02) vs Bitcoin Historical Price USD – All-Time Series (Habrador) (Price)
- Pearson correlation (r)
- 0.6987
- Spearman correlation
- 0.5088
- p-value
- 0
- Sample size (n)
- 194
- 95% confidence interval
- 0.6188 to 0.7644
- Granger causality
- None
- Granger optimal lag
- 2
- Time coverage
- 2010-08-01 to 2026-09-01
- Recomputed on refreshed data
- 2026-10-24 (r was 0.6916)
AI analysis
Correlation Analysis: Bitcoin Price vs. Used Car & Truck CPI
1. What the Visualization Reveals
The scatterplot shows a moderate positive relationship between Bitcoin's historical USD price and the US CPI sub-index for used cars and trucks. As Bitcoin price increases across its multi-year trajectory (spanning fractions of a cent to over $118,000), the used car CPI index also trends upward, moving roughly from the mid-130s/140s toward the 180s-210s range. However, the relationship is far from a clean linear trend — there's substantial scatter and evidence of non-monotonic behavior at the extremes.
2. Strength, Direction, and Statistical Confidence
The correlation coefficient (r = 0.69) indicates a moderate-to-strong positive linear association, with r² = 0.478 meaning only about 48% of the variance in one series is explained by the other — leaving more than half unexplained by this simple linear relationship. The 95% CI [0.609, 0.759] is reasonably tight and excludes zero, and the p-value of ~0 confirms this correlation is highly unlikely to be due to chance in this sample. However, correlation ≠ causation, and this is strongly reinforced by the Granger causality tests: neither direction shows significant predictive power (X→Y: p=0.834; Y→X: p=0.742). This means neither series helps forecast the other's future values based on past values — the relationship is likely driven by both series independently trending over the same calendar period rather than any direct mechanistic link.
3. Notable Patterns and Outliers
Several structural features stand out: - Compressed low-X cluster: Many points sit at very low X values (near 0–20), corresponding to Bitcoin's early history (2010-2013), where CPI values hover tightly around 144-152. - Non-monotonic behavior at high X: Notably, points like (44354, 209.65) and (56973, 211.73) show CPI peaking before Bitcoin's price reaches its maximum, while (45092, 154.93) shows a sharp drop-off at similarly high Bitcoin values — suggesting a non-linear or even inverted local relationship in the upper-middle range, likely corresponding to the 2021-2022 CPI spike (pandemic supply chain disruption) followed by normalization, decoupled from Bitcoin's price swings. - Local dip: Bitcoin prices in the 7,000-13,000 range correspond to CPI values dipping below 140 (lower than the early-history baseline), indicating the relationship is not simply monotonic.
4. Confounding Factors and Caveats
This is a classic case of spurious correlation via shared time trend. Both series are essentially time-series that have grown/fluctuated over 2010-2026, and pairing them by index (rather than by matched date) risks conflating "both increase over time" with genuine association. The used car CPI is driven by supply chain shocks, interest rates, and inflation — fundamentally unrelated economic mechanisms compared to Bitcoin's price, which is driven by crypto-specific speculation, adoption cycles, and liquidity. The Granger non-causality result is the critical caveat here: it strongly suggests this r²=0.48 is an artifact of co-trending non-stationary series rather than a meaningful economic relationship.
5. Actionable Insights
- Do not use this correlation for forecasting — the Granger results explicitly rule out predictive utility in either direction. - De-trend or difference both series (e.g., use month-over-month % changes rather than levels) and re-run correlation analysis; this is standard practice for non-stationary time series and would likely reveal the "true" correlation is much weaker or negligible. - Investigate common macro drivers (e.g., broad inflation, monetary policy/interest rates, USD strength) as potential latent confounders affecting both series independently. - Treat this relationship as coincidental co-movement over a shared calendar period rather than an actionable trading or economic signal.
X dataset: Bitcoin Historical Price USD – All-Time Series (Habrador)
Y dataset: US Consumer Price Index: Used Cars & Trucks (FRED CUSR0000SETA02)
Part of experiment: Bitcoin - Bitcoin Historical Price USD – All-Time Series (Habrador) vs US Consumer Price Index: Used Cars & Trucks (FRED CUSR0000SETA02)