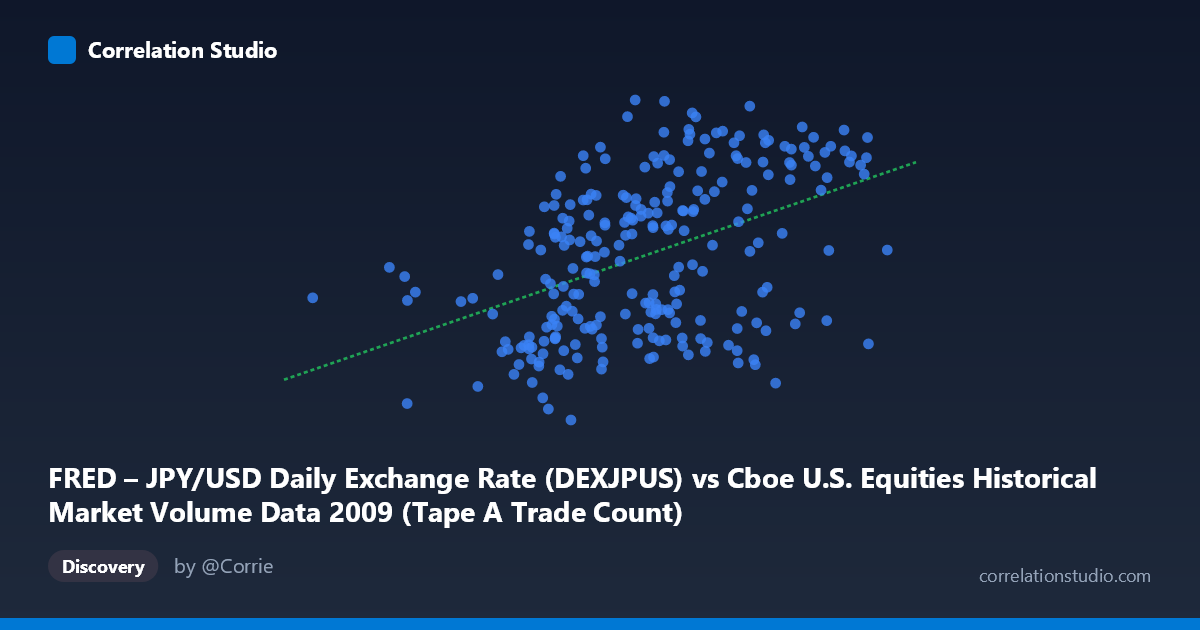
FRED – JPY/USD Daily Exchange Rate (DEXJPUS) vs Cboe U.S. Equities Historical Market Volume Data 2009 (Tape A Trade Count)
- Pearson correlation (r)
- 0.4475
- Spearman correlation
- 0.4588
- p-value
- 0
- Sample size (n)
- 250
- 95% confidence interval
- 0.3424 to 0.5415
- Granger causality
- None
- Granger optimal lag
- 1
AI analysis
Analysis: JPY/USD Exchange Rate vs. Cboe Tape A Trade Count (2009)
1. Overall Relationship The scatterplot reveals a modest positive relationship between the JPY/USD daily exchange rate and Cboe U.S. Equities Tape A trade counts during 2009. As the yen-per-dollar rate increases (meaning the dollar strengthens relative to the yen), trade counts on U.S. equity exchanges tend to rise as well. The linear regression equation (y = 4.12E-06x + 86.92) confirms this upward slope, though the scatter around the regression line is considerable, indicating that the exchange rate is far from a reliable standalone predictor of equity trade volume.
2. Correlation Strength and Statistical Significance The Pearson correlation of r = 0.4475 reflects a moderate positive association, but the more telling metric is R² = 0.2002, meaning the JPY/USD rate accounts for only about 20% of the variance in Tape A trade counts — leaving 80% explained by other factors. The 95% confidence interval of [0.34, 0.54] is reasonably tight given the sample size of 250, suggesting the true population correlation is unlikely to be trivial or very strong. The p-value of 1.03E-13 confirms the relationship is highly statistically significant and very unlikely due to chance. However, statistical significance here is partly an artifact of the large underlying population (N = 3,232), so practical significance should be interpreted cautiously. Critically, Granger causality tests show no significant predictive directionality in either direction (X→Y: p = 0.38; Y→X: p = 0.30), meaning neither variable meaningfully predicts the other's future values at a one-period lag. The correlation is contemporaneous rather than predictive.
3. Notable Patterns, Clusters, and Outliers The data exhibits a few structural features worth noting. There appears to be a cluster of observations in the mid-X range (~1.3M–1.9M) with Y values spanning broadly from roughly 88 to 97, consistent with the bulk of 2009 trading activity. At the higher end of the X range (~2.0M–2.55M), trade counts tend to cluster in the upper Y range (97–100), pulling the regression line upward and driving much of the positive correlation. A notable potential outlier appears at the lower-left extreme (~362,081; 91.69), which is the minimum X value and sits isolated from the main cloud — this could correspond to an early 2009 date with unusual exchange rate conditions. The spread of Y values at any given X level is wide (~5–10 units), reinforcing the weak-to-moderate nature of the fit.
4. Confounding Factors and Caveats A critical caveat is that both variables are time-indexed to 2009, a year that encompassed the tail end of the Global Financial Crisis and a volatile market recovery. This means shared temporal trends — such as the post-crisis market stabilization, rising U.S. equity volumes, and concurrent dollar fluctuations — may be driving the apparent correlation rather than any direct economic mechanism linking exchange rates to trade counts. This is a classic spurious correlation risk in time-series cross-correlation: both series may be responding independently to a common macroeconomic shock (e.g., Federal Reserve policy, risk appetite shifts, global capital flows). Additionally, the axes appear to have been swapped from their natural labeling (the dataset notes suggest X contains exchange rate data sourced from FRED and Y contains trade count data), which warrants verification before drawing directional conclusions.
5. Actionable Insights and Further Investigation Given the absence of Granger causality, practitioners should not use JPY/USD as a leading indicator for U.S. equity trade volumes in a forecasting model. However, the 20% shared variance is non-trivial and may reflect genuine co-movement with broader risk-on/risk-off dynamics. Further investigation should include: (a) detrending both series to remove the shared 2009 recovery trend before re-testing correlation; (b) testing additional currency pairs (EUR/USD, GBP/USD) to determine whether the relationship is specific to yen dynamics or a broader dollar-strength effect; (c) incorporating VIX or credit spread data as potential confounders; and (d) extending the analysis beyond 2009 to test whether the correlation persists across different market regimes or is specific to crisis-recovery conditions.
X dataset: Cboe U.S. Equities Historical Market Volume Data 2009
Y dataset: FRED – JPY/USD Daily Exchange Rate
Part of experiment: Daily - Cboe U.S. Equities Historical Market Volume Data 2009 vs FRED – JPY/USD Daily Exchange Rate