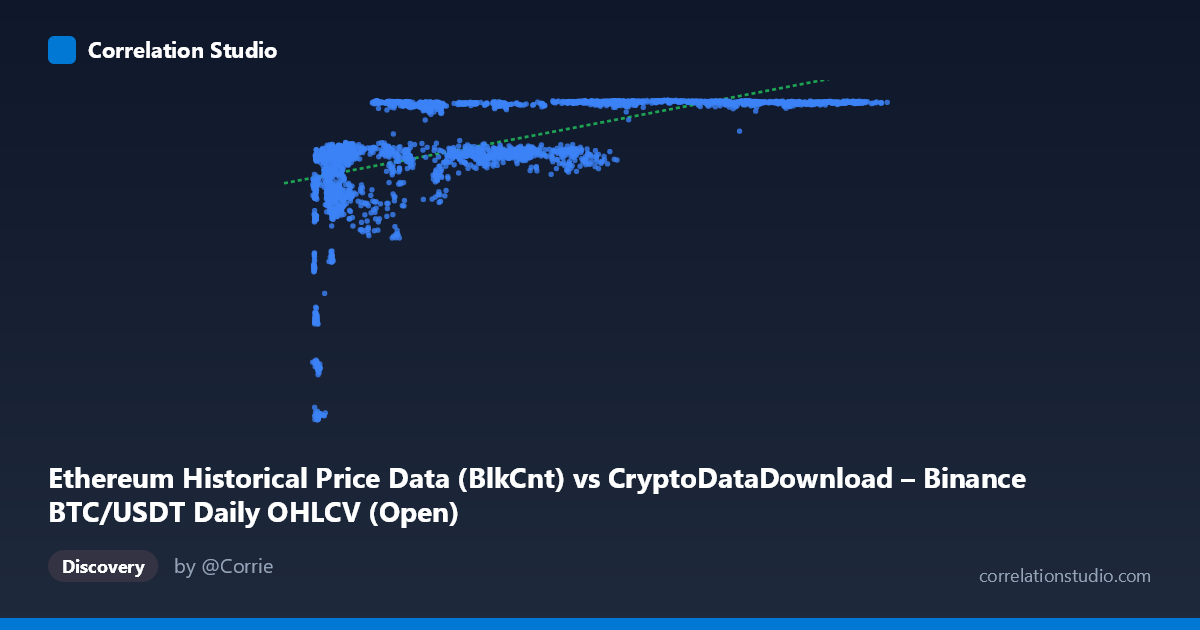
Ethereum Historical Price Data (BlkCnt) vs CryptoDataDownload – Binance BTC/USDT Daily OHLCV (Open)
- Pearson correlation (r)
- 0.5723
- Spearman correlation
- 0.7299
- p-value
- 0
- Sample size (n)
- 3191
- 95% confidence interval
- 0.5485 to 0.5952
- Granger causality
- None
- Granger optimal lag
- 1
AI analysis
Analysis of the Relationship Between X and Y
1. What the visualization reveals
The scatterplot shows a clear non-linear, saturating relationship rather than a simple linear one. At low X values (roughly 3,000–15,000), Y rises steeply — climbing from ~2,800 to ~6,400 over a relatively narrow X range. Beyond X ≈ 20,000–25,000, Y plateaus in a tight band between approximately 6,300 and 7,180, and stays there even as X extends out to 124,000+. This produces a classic logarithmic or "diminishing returns" curve: strong sensitivity at low values, followed by flattening at higher values.
2. Strength, direction, and statistical meaning
The Pearson correlation (r = 0.572) is moderate, with r² indicating only 32.8% of Y's variance is explained by a linear fit to X. The 95% CI [0.549, 0.595] is narrow and the p-value is effectively 0, so despite modest explanatory power, the correlation itself is highly statistically reliable given the large sample (n=3,191) — there's essentially no doubt a real association exists, just that it's not fully linear. The note that Spearman ρ exceeds Pearson r confirms this: rank-based correlation captures the monotonic (log-like) relationship better than the linear model does, meaning the "true" R² using a log or power-law transform of X would likely be substantially higher than 32.8%.
Critically, Granger causality tests show no significant predictive direction either way (X→Y: p=0.498; Y→X: p=0.792). This means neither series' past values help forecast the other's future values in a time-series sense. Combined with the moderate contemporaneous correlation, this suggests the relationship is likely driven by a shared underlying trend or common external driver (e.g., both being tied to overall market growth/adoption over the 2017–2026 window) rather than one variable mechanically causing or leading the other.
3. Notable patterns and outliers
The most striking feature is the compressed low-X cluster: points with X < 15,000 span the full lower range of Y (2,800–6,500), showing high variance in Y even for similar X values in that zone — this is where the model fits worst. The high-X plateau (X 60,000) is much more stable, with Y consistently in the 7,100–7,180 range and very low scatter, resembling an asymptotic ceiling. There don't appear to be extreme outliers, but the two-regime structure (steep rise, then plateau) is the dominant non-linear feature and is the reason a straight-line fit underperforms.
4. Confounding factors and caveats
Both variables span a multi-year period (2017–2026) and are likely non-stationary, trending series (BTC block count and BTC/ETH open prices) — a common pitfall where two unrelated trending time series show spurious correlation simply because both increase/evolve over time. The lack of Granger causality supports treating this as a correlation without demonstrated causal linkage. Additionally, mismatched labeling in the dataset description (X labeled as an Ethereum block-count field but described as BTC/USDT OHLCV, Y labened similarly ambiguously) raises concerns about data provenance/joining — this should be verified before drawing substantive conclusions.
5. Suggestions for further investigation
- Refit using a logarithmic or power transform of X (e.g., Y ~ log(X)) — expect meaningfully higher R² given the Spearman/Pearson gap and visible saturation curve. - Test for stationarity (ADF test) and consider differencing or detrending both series before any causal analysis, since Granger tests on non-stationary data can be unreliable/misleading. - Segment the analysis by X range (e.g., X<20,000 vs. X20,000) to model the two regimes separately, since a single global fit obscures the plateau behavior. - Clarify and validate the actual source columns/units for X and Y, given inconsistencies in the provided metadata, to ensure the relationship being modeled is meaningful. - Explore a shared third-variable/common-trend model (e.g., regressing both on time or on a market-wide index) to test whether the correlation is confounded by a mutual driver rather than a direct relationship.
X dataset: CryptoDataDownload – Binance BTC/USDT Daily OHLCV
Y dataset: Ethereum Historical Price Data
Part of experiment: Bitcoin - CryptoDataDownload – Binance BTC/USDT Daily OHLCV vs Ethereum Historical Price Data