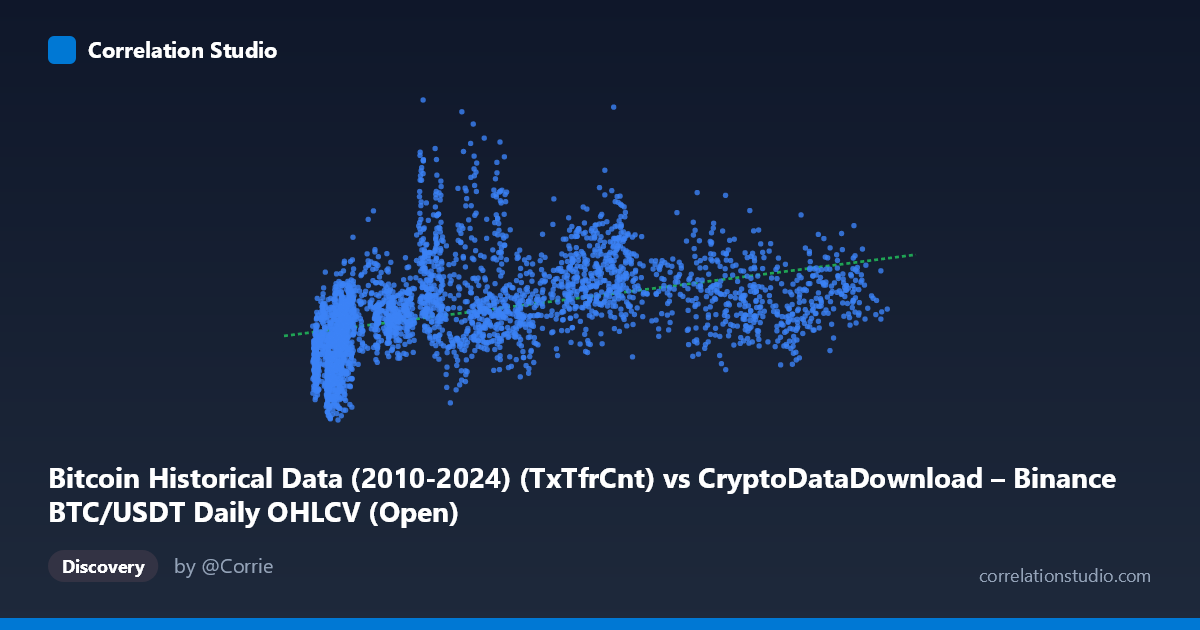
Bitcoin Historical Data (2010-2024) (TxTfrCnt) vs CryptoDataDownload – Binance BTC/USDT Daily OHLCV (Open)
- Pearson correlation (r)
- 0.4341
- Spearman correlation
- 0.6005
- p-value
- 0
- Sample size (n)
- 3191
- 95% confidence interval
- 0.4055 to 0.4619
- Granger causality
- None
- Granger optimal lag
- 10
- Time coverage
- 2017-08-17 to 2026-05-20
AI analysis
Analysis: Bitcoin Transaction Count vs. Opening Price
1. Overall Relationship
The scatterplot depicts a moderate, positive relationship between Bitcoin's daily transaction count (X) and its opening price (Y). Points scattered across the sample show a general upward tendency — as transaction counts increase from the low thousands to over 100,000, opening prices trend from roughly $370K-$530K into the $850K-$1.38M range — but the relationship is loose rather than tight, with considerable vertical scatter at any given X value (e.g., transaction counts near 10,000 correspond to prices ranging from ~$370K to ~$942K).
2. Strength, Direction, and Statistical Confidence
The Pearson correlation of r = 0.434 indicates a moderate positive linear association. However, r² = 0.189 reveals that transaction count explains only about 19% of the variance in opening price — the remaining 81% is driven by other factors (macro sentiment, liquidity, halving cycles, regulatory news, etc.). The 95% CI [0.406, 0.462] is fairly narrow given the large sample (n=3,191), and the p-value of ~0 confirms the correlation is statistically significant and not due to chance — but statistical significance here reflects sample size more than practical strength. Critically, the Granger causality tests show no significant predictive direction in either direction (X→Y: p=0.247; Y→X: p=0.921). This means neither variable reliably "leads" the other in time — transaction activity does not appear to forecast price movements, nor vice versa, at least at the tested lag structure. This is an important caveat: correlation without Granger causality suggests both series may be co-moving due to a shared external driver (e.g., overall market growth/adoption trends) rather than one causing the other.
3. Patterns and Non-linear Features
The data hints at a non-linear relationship — the note that Spearman ρ exceeds Pearson r is a strong signal that a monotonic but curved relationship (logarithmic or power-law) may fit better than a straight line. This makes intuitive sense: transaction counts and price often both grow with adoption, but transaction throughput has physical/protocol limits (block size, mempool capacity) that could cause diminishing returns at high X, while price can still swing dramatically due to speculation. There's also a visible cluster of low-X, low-to-mid Y points (X < 15,000, Y between $370K-$950K) representing likely early-history observations, and a sparser tail of high-X points (X 80,000) that align with elevated but variable prices — suggesting increasing transaction activity coincides with bull-market periods without a strictly proportional price response. Some outliers exist, such as (11,329.99, 942,057) or (28,730.51, 1,210,147), where price is high despite modest transaction counts, likely reflecting speculative price spikes decoupled from network usage.
4. Confounding Factors and Caveats
Several confounds likely inflate or distort this correlation: - Time-trend confounding: Both series may simply be trending upward over the 2017–2026 window (price due to long-term BTC appreciation, transaction count due to network adoption), producing spurious correlation without direct causal linkage. This is consistent with the null Granger result. - Non-stationarity: Price and transaction count are classic non-stationary time series; without differencing or detrending, Pearson/Granger results can be unreliable or biased. - External macro factors: Regulatory announcements, ETF approvals, halving events, and exchange-specific dynamics (this is Binance data) can move price independently of on-chain activity. - Data granularity/lag structure: The "optimal lag = 10 periods" for Granger tests may not capture longer causal chains (e.g., price rallies driving transaction surges weeks later).
5. Recommendations for Further Investigation
- Detrend or difference both series (e.g., use daily returns/log-changes) before re-running correlation and Granger tests to strip out shared long-term trends and test for genuine short-term dynamic relationships. - Fit a log-linear or polynomial model given the Spearman/Pearson divergence — a log(X) vs. Y or log-log specification may substantially improve fit. - Segment by market regime (bull/bear/sideways) to check if the X-Y relationship strength varies across cycles. - Test additional lags and lead-lag windows beyond 10 periods, and consider Vector Autoregression (VAR) or cointegration analysis (e.g., Johansen test) given both series are likely I(1). - Treat transaction count as one input among many (not a standalone price predictor) — combine with hash rate, active addresses, and macro liquidity indicators for a more robust price-driver model.
X dataset: CryptoDataDownload – Binance BTC/USDT Daily OHLCV
Y dataset: Bitcoin Historical Data (2010-2024)
Part of experiment: Bitcoin - CryptoDataDownload – Binance BTC/USDT Daily OHLCV vs Bitcoin Historical Data (2010-2024)