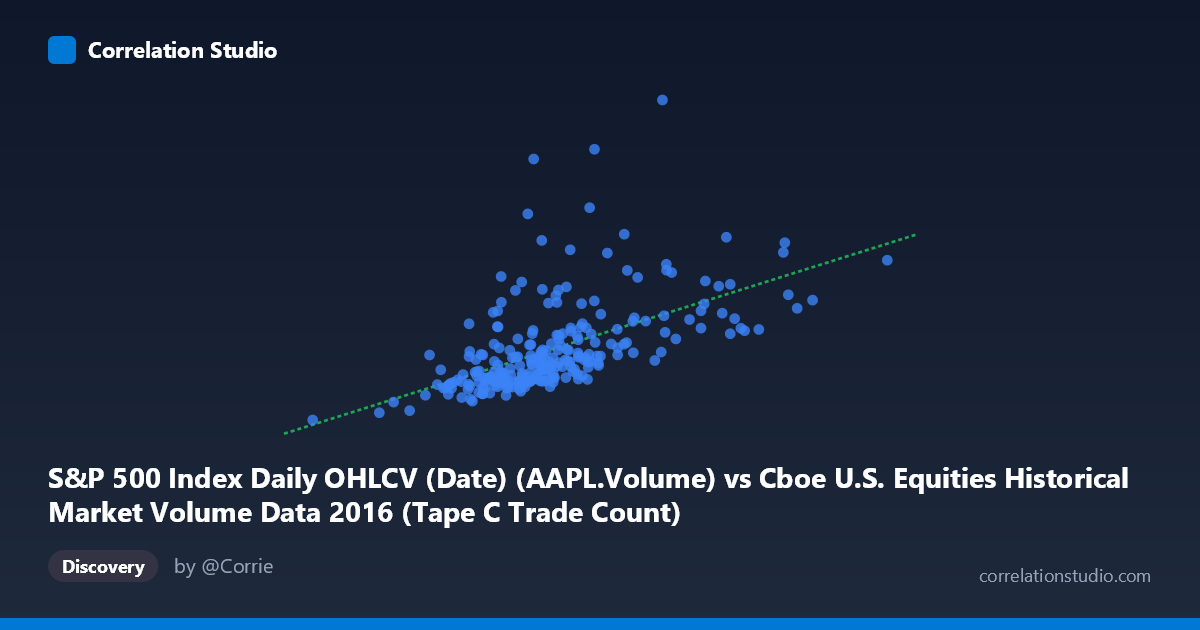
S&P 500 Index Daily OHLCV (Date) (AAPL.Volume) vs Cboe U.S. Equities Historical Market Volume Data 2016 (Tape C Trade Count)
- Pearson correlation (r)
- 0.5644
- Spearman correlation
- 0.6631
- p-value
- 0
- Sample size (n)
- 252
- 95% confidence interval
- 0.4738 to 0.6431
- Granger causality
- None
- Granger optimal lag
- 10
AI analysis
Scatterplot Analysis: AAPL Trading Volume vs. Cboe Tape C Trade Count (2016)
Relationship Overview
The scatterplot reveals a moderate positive relationship between Apple Inc.'s daily trading volume (X-axis, drawn from S&P 500 OHLCV data) and the Cboe U.S. Equities Tape C Trade Count (Y-axis). As AAPL volume increases, Tape C trade counts tend to rise as well, consistent with the intuition that heavy trading in a flagship stock like AAPL coincides with broader market activity. The linear regression equation (y = 65.95x − 8,629,020) confirms this positive slope, though the wide scatter around the fitted line signals that the relationship is far from deterministic. The data spans the full 2016 calendar year (January 4 – December 30), capturing 252 paired daily observations out of a population of 506.
Correlation Strength and Statistical Significance
The Pearson correlation of r = 0.5644 indicates a moderate positive association, but the more telling figure is r² = 0.3185: only about 31.9% of the variance in Tape C trade counts is explained by AAPL volume. Nearly 68% of the variation in Y remains attributable to other factors entirely. The 95% confidence interval for r [0.4738, 0.6431] is reasonably tight and does not cross zero, and the p-value rounds to effectively zero, confirming the correlation is highly statistically significant and not a sampling artifact. However, statistical significance should not be conflated with practical predictive power — the explained variance is modest. Critically, Granger causality tests find no significant directional predictability in either direction (X→Y: F = 1.00, p = 0.44; Y→X: F = 0.84, p = 0.59) at the optimal 10-period lag. This means that knowing today's AAPL volume does not meaningfully improve forecasts of future Tape C trade counts beyond what the historical series alone provides, and vice versa — the correlation is likely contemporaneous and driven by shared market conditions rather than a lead-lag dynamic.
Notable Patterns, Clusters, and Outliers
The bulk of observations cluster in a relatively compact region — AAPL volume roughly between 500,000 and 850,000 (likely in hundreds or thousands of shares, given the axis scale) and Tape C trade counts between approximately 20 million and 55 million. Within this core cluster, the scatter is broad, reflecting the modest r². Several high-leverage outliers are visually prominent and deserve attention: one point near (914,264; 133,369,700) represents an extreme value — the maximum Y in the dataset — and likely corresponds to a specific high-volatility event day in 2016 (e.g., Brexit vote aftermath in late June or the U.S. election in November). Another cluster of moderately elevated Y values (60–92 million trade counts) at middling X values, such as (781,788; 92,344,800) and (746,426; 76,314,700), suggests that Y can spike dramatically without proportionally large AAPL volume, hinting at market-wide stress events that lift all boats in trade count but don't necessarily concentrate in AAPL specifically. There is also mild heteroscedasticity — variance in Y appears to fan out at higher X values — suggesting the linear model's assumptions may not hold uniformly across the full range.
Confounding Factors and Interpretive Caveats
Several confounding factors complicate a causal interpretation. First, both variables are strongly driven by aggregate market conditions — volatility spikes, macroeconomic announcements, earnings seasons, and geopolitical events (Brexit, the 2016 U.S. presidential election) inflate both AAPL volume and overall trade counts simultaneously, creating spurious correlation without a direct mechanism. Second, the dataset labels appear swapped or cross-joined between the two source datasets (AAPL volume is listed as coming from the Cboe dataset and Tape C from the S&P 500 OHLCV file), which warrants a data provenance check before drawing firm conclusions. Third, AAPL's outsized weight in major indices means it may serve as a proxy for broad market sentiment rather than an independent variable. Finally, the 10-period optimal lag in the Granger test and the non-significant results suggest that any predictive signal, if present, dissipates quickly and is not exploitable at standard lags.
Actionable Insights and Further Investigation
Despite the limitations, the moderate correlation offers several actionable directions. Practitioners could incorporate AAPL volume as one feature among many in a broader market activity model — not as a standalone predictor — given that it explains roughly a third of Tape C variance. To improve the model, it would be worthwhile to test non-linear specifications (e.g., log-log transformation) given the apparent heteroscedasticity and the presence of extreme outliers. Outlier days should be flagged and investigated individually: identifying whether the extreme Tape C spikes correspond to known market events would allow for event-dummy variables that could substantially improve R². Additionally, extending the analysis to multiple years would test whether this correlation is stable or a 2016-specific artifact driven by that year's unique volatility profile. Finally, replacing AAPL volume with a broader index volume metric (e.g., SPY volume) might yield a stronger and more theoretically grounded predictor of exchange-wide trade counts.
X dataset: Cboe U.S. Equities Historical Market Volume Data 2016
Y dataset: S&P 500 Index Daily OHLCV (Date)
Part of experiment: Daily - Cboe U.S. Equities Historical Market Volume Data 2016 vs S&P 500 Index Daily OHLCV (Date)