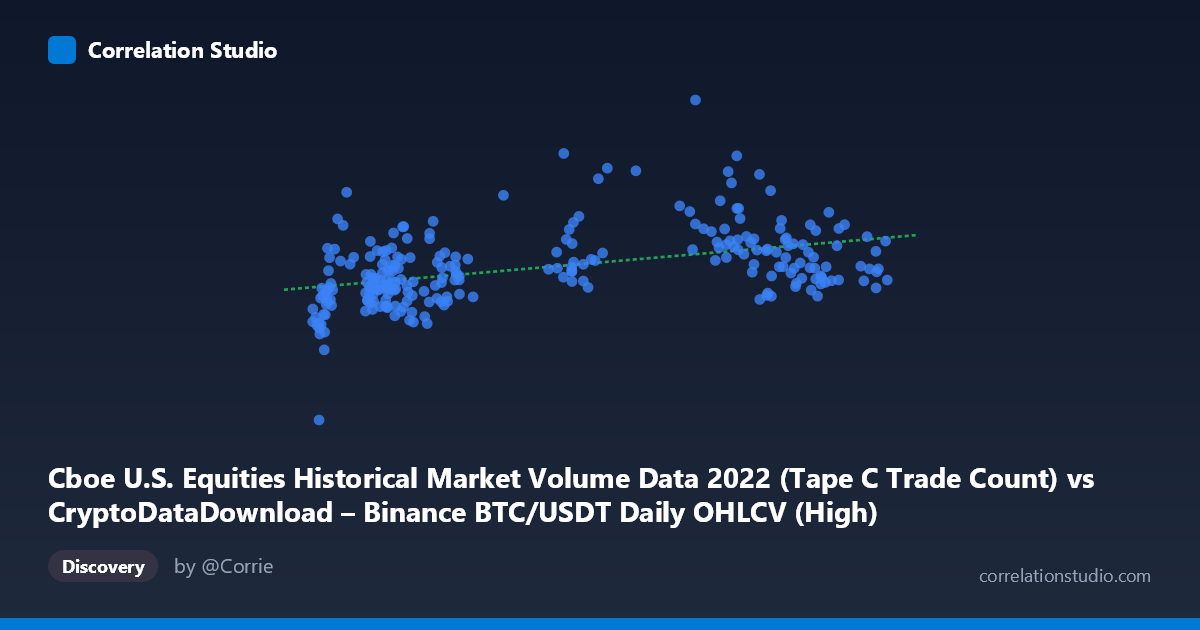
Cboe U.S. Equities Historical Market Volume Data 2022 (Tape C Trade Count) vs CryptoDataDownload – Binance BTC/USDT Daily OHLCV (High)
- Pearson correlation (r)
- 0.4416
- Spearman correlation
- 0.4823
- p-value
- 0
- Sample size (n)
- 251
- 95% confidence interval
- 0.3361 to 0.5361
- Granger causality
- None
- Granger optimal lag
- 10
- Time coverage
- 2022-01-03 to 2022-12-30
AI analysis
Analysis: Cboe Tape C Trade Count vs. Binance BTC/USDT High
1. What the Visualization Reveals
The scatterplot shows a modest positive association between Cboe U.S. equities Tape C trade counts and Binance BTC/USDT daily high prices across 2022. Points are widely scattered around the regression line (y = 10.99x + 1,415,080), with considerable vertical dispersion at every level of X — particularly in the 17,000–25,000 range, where Y values span roughly 1.35M to 2.5M+. This scatter pattern is consistent with a weak-to-moderate linear relationship rather than a tight, deterministic one.
2. Strength, Direction, and Statistical Confidence
The correlation coefficient (r = 0.442) indicates a moderate positive relationship, but r² = 0.195 reveals that only about 19.5% of the variance in BTC's daily high is explained by Tape C trade counts — leaving over 80% attributable to other factors. The 95% CI [0.336, 0.536] is reasonably tight and excludes zero, and the p-value (2.1×10⁻¹³) confirms this correlation is highly unlikely to be due to chance given the sample. However, statistical significance here reflects sample size and consistency, not practical predictive strength — r² remains the more honest gauge of real-world usefulness.
Critically, the Granger causality tests show no significant directional predictability in either direction (X→Y: p=0.65; Y→X: p=0.092, only marginal). This means neither series reliably helps forecast the other's future values based on past values, even at the "optimal" 10-period lag. This strongly suggests the correlation is likely driven by shared exposure to a common macro environment (e.g., 2022 risk-off sentiment affecting both equities activity and crypto prices) rather than any causal or lead-lag mechanism between equity trading volume and BTC pricing.
3. Notable Patterns and Outliers
Several clusters are visible: a dense group of low-X (17,000–24,000) points with Y values clustering around 1.4M–1.7M, alongside a subset of low-X points that spike to 1.9M–2.5M (e.g., 21,365 → 2,022,689; 30,243 → 2,539,165), creating a "fan" or heteroscedastic pattern — variance in Y appears to increase somewhat independent of X. There's no clear evidence of a nonlinear (e.g., quadratic or exponential) relationship; the scatter looks like linear signal buried in substantial noise. No extreme leverage outliers stand out, though the high-Y points at moderate-to-low X levels pull the regression line's slope and widen the confidence band.
4. Confounding Factors and Caveats
This pairing is inherently unusual: Tape C trade count measures U.S. equity market activity (Cboe-listed securities), while the Y variable is a crypto asset price (BTC high), not equity trading volume — the relationship may be spurious or mediated by broader macro factors (Fed policy, inflation prints, risk appetite, VIX-driven volatility) that simultaneously influenced both equity trading activity and crypto valuations throughout 2022's bear market. Both series are also non-stationary trending time series (2022 saw declining BTC prices overall), which can inflate correlation via shared trend/drift even without genuine linkage — a classic spurious regression risk. Additionally, daily frequency data may mask intraday dynamics, and 251 sampled points from 3,212 in the population raises questions about sampling methodology and representativeness.
5. Recommendations for Further Investigation
Given the trending nature of both series, analysts should difference or detrend the data (e.g., use daily returns instead of levels) and re-run correlation/Granger tests to check whether the relationship survives — this is essential before drawing causal inferences. Additionally, consider controlling for common macro variables (VIX, DXY, Fed rate decisions) via partial correlation or multivariate regression to isolate any genuine link. Given the lack of Granger causality, this pairing is not suitable for predictive/trading signal purposes; instead, treat it as an observational curiosity meriting deeper investigation into whether both series merely proxy for "market-wide risk sentiment" in 2022 rather than reflecting a meaningful economic relationship.
X dataset: CryptoDataDownload – Binance BTC/USDT Daily OHLCV
Y dataset: Cboe U.S. Equities Historical Market Volume Data 2022
Part of experiment: Bitcoin - CryptoDataDownload – Binance BTC/USDT Daily OHLCV vs Cboe U.S. Equities Historical Market Volume Data 2022