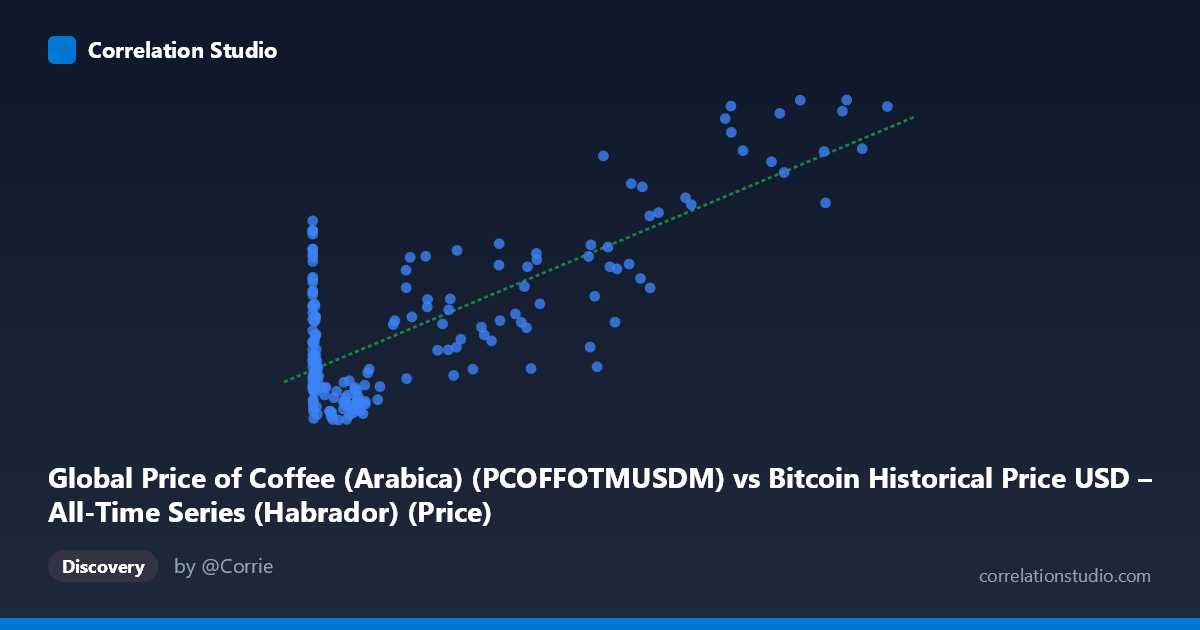
Global Price of Coffee (Arabica) (PCOFFOTMUSDM) vs Bitcoin Historical Price USD – All-Time Series (Habrador) (Price)
- Pearson correlation (r)
- 0.7625
- Spearman correlation
- 0.3047
- p-value
- 0
- Sample size (n)
- 188
- 95% confidence interval
- 0.6953 to 0.8165
- Granger causality
- None
- Granger optimal lag
- 4
AI analysis
Analysis: Bitcoin Price vs. Global Coffee (Arabica) Price
1. What the Visualization Reveals
The scatterplot shows a positive, moderately strong association between Bitcoin's historical USD price (X-axis) and the global price of Arabica coffee (Y-axis). Despite the enormous scale disparity in X (ranging from $0.06 to $118,670) versus the comparatively narrow Y range ($120–$410 cents/lb), the data displays a discernible upward trend: as Bitcoin prices climb into the tens of thousands, coffee prices also tend to sit at the higher end of their range. The relationship appears roughly linear once you account for the log-scale-like spread of Bitcoin values, though it's clearly not a tight, deterministic fit — there's substantial scatter around any fitted line.
2. Strength, Direction, and Statistical Confidence
The correlation coefficient (r = 0.76) indicates a strong positive linear relationship, with r² = 0.58 meaning 58% of the variance in coffee prices is statistically associated with Bitcoin price levels — leaving 42% unexplained by this single variable. The 95% CI [0.695, 0.817] is fairly tight and entirely excludes zero, and the p-value of ~0 confirms this correlation is highly unlikely to be due to chance alone. However, correlation is not causation, and this is emphatically confirmed by the Granger causality tests: neither direction shows significant predictive power (Bitcoin→Coffee: p=0.72; Coffee→Bitcoin: p=0.49). This means that despite the strong contemporaneous statistical association, past values of one series do not meaningfully help forecast future values of the other. Practically, this suggests both series may be responding to a shared external driver (e.g., a common time trend, global liquidity/inflation conditions, or USD strength) rather than one causing the other.
3. Notable Patterns and Outliers
Several structural features stand out: - Low-X cluster: A dense cluster of points near X≈0–1000 with highly variable Y values (spanning from ~120 to ~290) represents Bitcoin's early years (2010–2013), when Bitcoin prices were negligible but coffee prices already fluctuated independently based on its own agricultural/commodity cycles. - High-X tail: As Bitcoin exceeds $50,000–$100,000+, coffee prices consistently sit in the 250–400 range, suggesting these later time periods (2023–2026) coincide with elevated coffee prices — likely reflecting genuine commodity inflation (weather events, supply shocks in Brazil/Vietnam) occurring simultaneously with Bitcoin's bull markets. - Non-linearity: The relationship looks like it may better fit a logarithmic or power curve in X, given Bitcoin's exponential price growth — the linear model may understate the fit at low X and overstate it at extreme X values.
4. Confounding Factors and Caveats
This is a textbook case of spurious correlation via shared temporal trend. Both Bitcoin and coffee prices have risen over the 2010–2026 period due to entirely unrelated mechanisms — Bitcoin due to adoption/speculation cycles, coffee due to commodity inflation, climate impacts on crop yields, and currency effects. Since both series trend upward over time, any two upward-trending time series will show artificially inflated correlation (a classic "trend confound"). The Granger non-causality result is strong evidence supporting this interpretation — there's no genuine lead-lag predictive relationship, just coincidental co-movement over calendar time. Additionally, sampling mismatches (n=188 paired vs. population N=411) and monthly-vs-continuous data resolution differences between the two source datasets may introduce alignment noise.
5. Actionable Insights
- Do not use this correlation for trading/forecasting — the Granger results confirm it has no predictive value in either direction. - De-trend both series (e.g., using first differences, log returns, or detrending against a common time variable) and re-examine correlation; this will likely reveal the "true" relationship is much weaker once the shared upward trend is removed. - Investigate shared macro confounders directly — such as USD index, global M2 money supply, or inflation rates — as these are more plausible common drivers than any direct link between coffee and crypto markets. - If a genuine relationship is of interest, consider testing correlation within stationary sub-periods (e.g., year-over-year, detrended) rather than the raw price levels shown here.
X dataset: Bitcoin Historical Price USD – All-Time Series (Habrador)
Y dataset: Global Price of Coffee (Arabica)
Part of experiment: Bitcoin - Bitcoin Historical Price USD – All-Time Series (Habrador) vs Global Price of Coffee (Arabica)