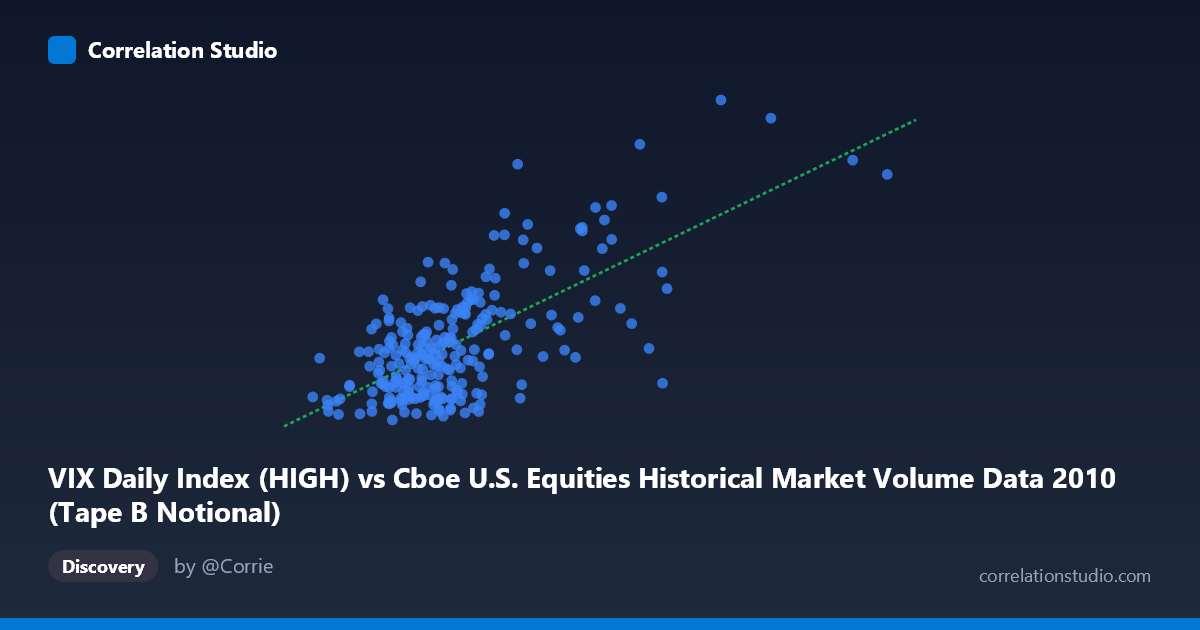
VIX Daily Index (HIGH) vs Cboe U.S. Equities Historical Market Volume Data 2010 (Tape B Notional)
- Pearson correlation (r)
- 0.6799
- Spearman correlation
- 0.5253
- p-value
- 0
- Sample size (n)
- 252
- 95% confidence interval
- 0.6074 to 0.7412
- Granger causality
- Bidirectional
- Granger optimal lag
- 1
AI analysis
Scatterplot Analysis: VIX High vs. Tape B Notional Volume (2010)
Relationship Overview
The scatterplot reveals a moderately strong positive relationship between the Cboe VIX Daily Index High values and Tape B Notional trading volume across U.S. equities exchanges in 2010. As VIX High readings increase — reflecting greater expected market volatility — Tape B Notional volume tends to rise correspondingly. This aligns intuitively with market microstructure theory: elevated volatility typically drives heightened trading activity as market participants reposition portfolios, hedge exposures, or respond to rapidly changing price signals. The linear regression equation (y = 1.95433E-09x + 13.6075) confirms a positive slope, indicating that each unit increase in VIX High is associated with a meaningful uplift in notional volume.
Correlation Strength and Statistical Significance
The Pearson correlation of r = 0.680 is statistically robust, with a p-value effectively at zero, confirming this relationship is not a chance artifact in the sample of 252 paired observations drawn from a population of 3,302. However, r² = 0.462 is the more practically important figure: only about 46% of the variance in Tape B Notional volume is explained by VIX High, meaning the majority of volume variation is driven by other factors entirely. The 95% confidence interval for r of [0.607, 0.741] is relatively tight, suggesting the estimate is stable across resampling. The Granger causality results add a critical temporal dimension: bidirectional causality is detected at a 1-period lag. The Y→X direction (F = 7.24, p = 0.008) is notably stronger than X→Y (F = 4.00, p = 0.047), suggesting that Tape B Notional volume preceding VIX High readings has stronger predictive power than the reverse — an intriguing finding implying that volume surges may anticipate volatility spikes rather than simply react to them.
Notable Patterns, Clusters, and Outliers
The scatterplot displays a heteroscedastic fan-shaped spread: at lower VIX High values (roughly 16–22), notional volumes cluster tightly at lower levels, while at higher VIX readings (30+), the vertical dispersion widens considerably. Several prominent outliers are visible in the upper-right quadrant — most notably the point near (15.1B, 42.15) and (11.8B, 48.2), which represent extreme VIX spikes accompanied by very high notional volumes. The point at approximately (15.96B, ~42) appears to be the most extreme X-axis value. Conversely, some high-volume observations occur at moderate VIX levels (e.g., the cluster around 22–26 VIX with volumes in the 6–9B range), suggesting volume can decouple from volatility during certain market regimes. The lower-left cluster is dense and relatively linear, while the upper range becomes increasingly scattered.
Confounding Factors and Caveats
Several important caveats apply. First, the axis labels appear swapped in dataset attribution — the VIX data is labeled as the X-axis source from the market volume dataset, and Tape B Notional is sourced from the VIX dataset file, which warrants verification before drawing firm conclusions. Second, 2010 was a distinctive market year marked by the May 6th Flash Crash, which almost certainly accounts for some extreme outliers and may artificially inflate both the correlation and Granger statistics. Third, Tape B Notional volume represents only one tape segment (NYSE American/regional exchanges), not total market volume, so broader market dynamics may not be fully captured. Fourth, the bidirectional Granger causality, while statistically present, should not be interpreted as true economic causation — common drivers such as macroeconomic announcements, Federal Reserve communications, or geopolitical events may simultaneously elevate both VIX and trading activity.
Actionable Insights and Further Investigation
Practitioners could use the confirmed Y→X Granger relationship to explore volume-based early warning signals for volatility regime shifts — if Tape B Notional surges precede VIX spikes, this could inform real-time risk monitoring frameworks. The unexplained ~54% of variance strongly motivates multivariate modeling, incorporating additional predictors such as bid-ask spreads, options open interest, or macroeconomic surprise indices. Removing or flagging Flash Crash period observations (May 6–7, 2010) and re-running the analysis would clarify whether the correlation is structurally persistent or partially event-driven. Finally, extending this analysis to multiple years would test whether the 0.68 correlation is specific to 2010's volatility regime or represents a durable structural relationship between market uncertainty and regional exchange activity.
X dataset: Cboe U.S. Equities Historical Market Volume Data 2010
Y dataset: VIX Daily Index
Part of experiment: Daily - Cboe U.S. Equities Historical Market Volume Data 2010 vs VIX Daily Index