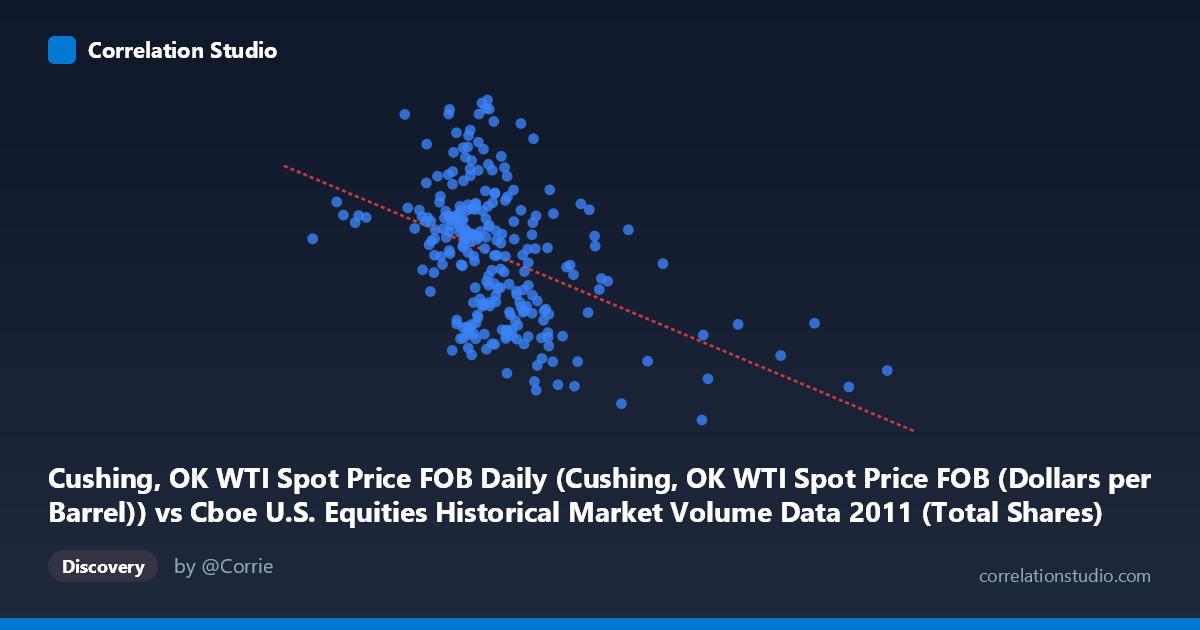
Cushing, OK WTI Spot Price FOB Daily (Cushing, OK WTI Spot Price FOB (Dollars per Barrel)) vs Cboe U.S. Equities Historical Market Volume Data 2011 (Total Shares)
- Pearson correlation (r)
- -0.4384
- Spearman correlation
- -0.4479
- p-value
- 0
- Sample size (n)
- 252
- 95% confidence interval
- -0.5331 to -0.3328
- Granger causality
- None
- Granger optimal lag
- 1
AI analysis
Analysis: WTI Crude Oil Price vs. U.S. Equity Market Trading Volume (2011)
Relationship Overview The scatterplot reveals a moderate negative relationship between WTI crude oil spot prices (X-axis) and U.S. equity market total shares traded (Y-axis) across 252 trading days in 2011. As oil prices rise, equity trading volume tends to decline. The linear regression equation (y = -2.88×10⁻⁸x + 109.935) confirms this inverse slope, suggesting that for every $1/barrel increase in oil prices, total shares traded decreases by approximately 2.88×10⁻⁸ units — a small per-unit effect that accumulates meaningfully across the observed price range (~$40/barrel spread), translating to a meaningful volume difference across the dataset's X range.
Correlation Strength and Statistical Significance The Pearson correlation of r = -0.4384 indicates a moderate negative association, but the more practically meaningful metric is R² = 0.1922 — oil prices explain only ~19.2% of the variance in equity trading volume, leaving roughly 80% attributable to other factors. While statistically highly significant (p = 2.944×10⁻¹³, effectively zero), this p-value reflects the large population size (N = 3,780) as much as effect magnitude. The 95% confidence interval of [-0.5331, -0.3328] is reasonably tight and entirely negative, confirming the inverse direction is robust and not a sampling artifact. Critically, Granger causality tests reveal no significant temporal predictive relationship in either direction — neither variable reliably predicts the other in subsequent periods (X→Y: F=0.115, p=0.734; Y→X: F=3.753, p=0.054). The Y→X direction approaches marginal significance, hinting weakly that volume may have slight predictive value for oil prices, but this falls short of conventional thresholds. This means the correlation reflects a contemporaneous association, not a leading indicator relationship.
Notable Patterns and Outliers Several features stand out in the data. There is visible scatter throughout the mid-range (oil prices ~$480–620M range on the encoded X-axis), where the bulk of observations cluster, producing a diffuse central cloud rather than a tight linear band — consistent with the modest R². A few high-leverage outliers are apparent: points near X = 808M and X = 878M (higher oil prices) with trading volumes around 86–94, pulling the regression line but sitting away from the main cluster. On the opposite end, observations around X = 242–293M show elevated Y values (~99–101), consistent with the negative slope. Some points at moderate oil prices display unusually high volume (e.g., ~108–111 shares), suggesting episodic spikes in trading activity independent of oil price levels — likely driven by market events, earnings seasons, or volatility shocks.
Confounding Factors and Caveats Several important caveats temper interpretation. 2011 was an exceptional year for financial markets, characterized by the European sovereign debt crisis, the U.S. debt ceiling standoff, the Arab Spring (directly affecting oil supply expectations), and heightened macro volatility — all of which simultaneously influenced both equity volumes and oil prices through shared underlying drivers (risk sentiment, institutional repositioning) rather than direct causation. This creates substantial spurious correlation risk: both variables may simply co-respond to broad risk-off/risk-on episodes. Additionally, the axis labeling in the dataset description appears inverted (X described as volume data but labeled as WTI price, and vice versa), warranting verification of data alignment. The lack of Granger causality further argues that the observed correlation is not mechanistic in the short-term sense — oil prices don't cause volume changes or vice versa within daily lags.
Actionable Insights and Further Investigation Despite explaining only ~19% of variance, this relationship has practical relevance for market microstructure and macro trading research. Practitioners monitoring liquidity conditions could track oil prices as one contextual signal among many for expected volume regimes. For further investigation: (1) Segment the analysis by volatility regime (e.g., VIX quintiles) to test whether the correlation strengthens during high-uncertainty periods; (2) Extend Granger causality testing to longer lags (5–10 days) to capture slower transmission mechanisms; (3) Add the U.S. dollar index and equity volatility (VIX) as control variables in a multivariate regression to isolate whether the oil-volume relationship persists after accounting for shared macro drivers; (4) Replicate across multiple years (2008–2020) to assess whether this 2011 pattern is idiosyncratic to a crisis year or a persistent structural feature of market dynamics.
X dataset: Cboe U.S. Equities Historical Market Volume Data 2011
Y dataset: Cushing, OK WTI Spot Price FOB Daily
Part of experiment: Daily - Cboe U.S. Equities Historical Market Volume Data 2011 vs Cushing, OK WTI Spot Price FOB Daily