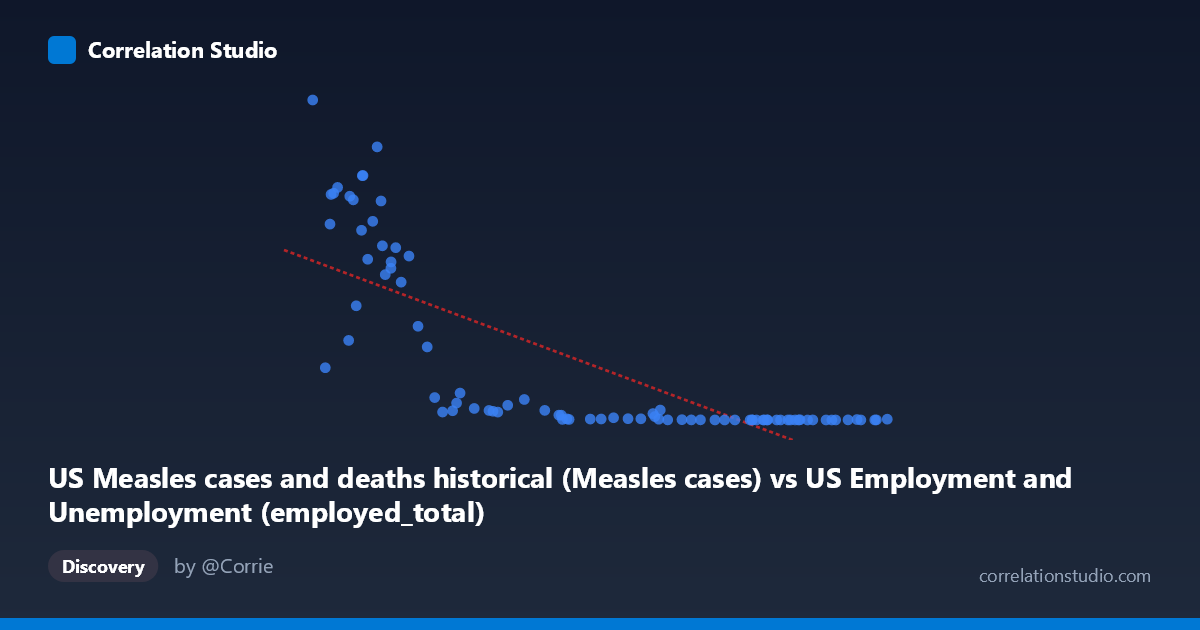
US Measles cases and deaths historical (Measles cases) vs US Employment and Unemployment (employed_total)
- Pearson correlation (r)
- -0.7659
- Spearman correlation
- -0.9115
- p-value
- 0
- Sample size (n)
- 85
- 95% confidence interval
- -0.8416 to -0.6606
- Granger causality
- None
- Granger optimal lag
- 10
AI analysis
Scatterplot Analysis: US Measles Cases vs. Total Employment
1. Overall Relationship Pattern
The scatterplot reveals a strong negative relationship between US measles cases (X-axis) and total US employment (Y-axis), spanning data from 1941 to 2025. The pattern is visually striking: when measles cases are high (50,000–165,000 range), employment figures span an enormous range, while the bulk of points cluster at lower measles case counts with relatively compressed employment values. Critically, the relationship is clearly non-linear — the data traces a sharp hyperbolic or exponential decay curve rather than a straight line, with employment values plummeting rapidly as measles cases increase beyond roughly 80,000–90,000. This curvature is an important structural feature that the linear regression model only partially captures.
2. Correlation Strength, Direction, and Temporal Causality
The Pearson r of -0.7659 indicates a strong negative correlation, with r² = 0.587, meaning the linear model explains approximately 58.7% of the variance in employment — a substantial but incomplete account. The 95% confidence interval of [-0.84, -0.66] is relatively tight and does not include zero, and the p-value of effectively 0 confirms this correlation is highly statistically significant across n=85 paired annual observations. The note that Spearman ρ exceeds Pearson r is telling — it confirms the underlying relationship is better described by a monotonic non-linear function (likely logarithmic or power-law) than by a straight line, meaning the true association is likely even stronger than the linear r suggests once the functional form is properly specified. Crucially, however, Granger causality tests find no significant predictive direction in either direction (X→Y: F=1.57, p=0.14; Y→X: F=1.39, p=0.21), meaning neither variable temporally predicts the other at the optimal 10-period lag. This directly undermines any causal interpretation.
3. Notable Patterns, Clusters, and Outliers
Several structural features stand out:
- High-leverage outliers at low X values: Points near X=50,000–65,000 show enormous Y values (449,000–894,000 employed), with considerable vertical scatter, suggesting high variability in employment during periods of lower measles incidence - A dense low-Y cluster: The majority of points with X 100,000 compress tightly near Y ≈ 0–30,000, forming a nearly flat cluster that anchors the right side of the plot - The extreme outlier at (50,350; 894,134) sits at the upper-left corner and likely represents a specific year (possibly early 1940s) with both minimal measles cases and peak wartime/postwar employment — it exerts significant leverage on the regression - The curvature inflection appears around X ≈ 80,000–90,000, where Y drops from hundreds of thousands to tens of thousands rapidly, consistent with an exponential or reciprocal functional form rather than linear
4. Confounding Factors and Interpretation Caveats
The most important caveat is that this correlation almost certainly reflects shared trends over time rather than any direct relationship between measles and employment. Both variables are dominated by long-run secular trends: measles cases declined dramatically following vaccine introduction in 1963 and the 1978 elimination campaign, while US total employment grew steadily across most of the 20th and 21st centuries driven by population growth, economic expansion, and labor force participation changes. Time is the primary confounding variable — it drives both series in opposite directions simultaneously, creating a spurious negative correlation. Additional confounders include population growth (more people = more workers AND more potential measles hosts, but vaccines changed the latter), public health infrastructure changes, and economic cycles. The dataset labeling also warrants scrutiny: the axis labels suggest each variable may have been pulled from the other dataset (measles cases from the employment dataset file, employment from the measles file), which may indicate a data merging or labeling artifact that should be verified before drawing any conclusions.
5. Actionable Insights and Further Investigation
Given the likely spurious nature of this correlation, the priority next steps should be:
1. Detrend both time series (e.g., first-differencing or HP filter) and re-examine the correlation — the r will likely collapse substantially, clarifying whether any genuine relationship exists beyond shared temporal trends 2. Fit a logarithmic or power-law model (given the Spearman Pearson signal) to better characterize the functional form and improve r² beyond the current 58.7% 3. Introduce explicit time as a covariate in a multivariate regression to partial out the secular trend effect 4. Verify the dataset-column alignment — the apparent cross-labeling (measles column from employment dataset and vice versa) should be audited to ensure data integrity 5. Investigate the 1963 vaccine introduction as a structural break using Chow test or regime-switching models, as this event fundamentally altered the measles trajectory and may explain the non-linearity observed around the inflection point in the scatterplot
X dataset: US Employment and Unemployment
Y dataset: US Measles cases and deaths historical
Part of experiment: Yearly - US Employment and Unemployment vs US Measles cases and deaths historical