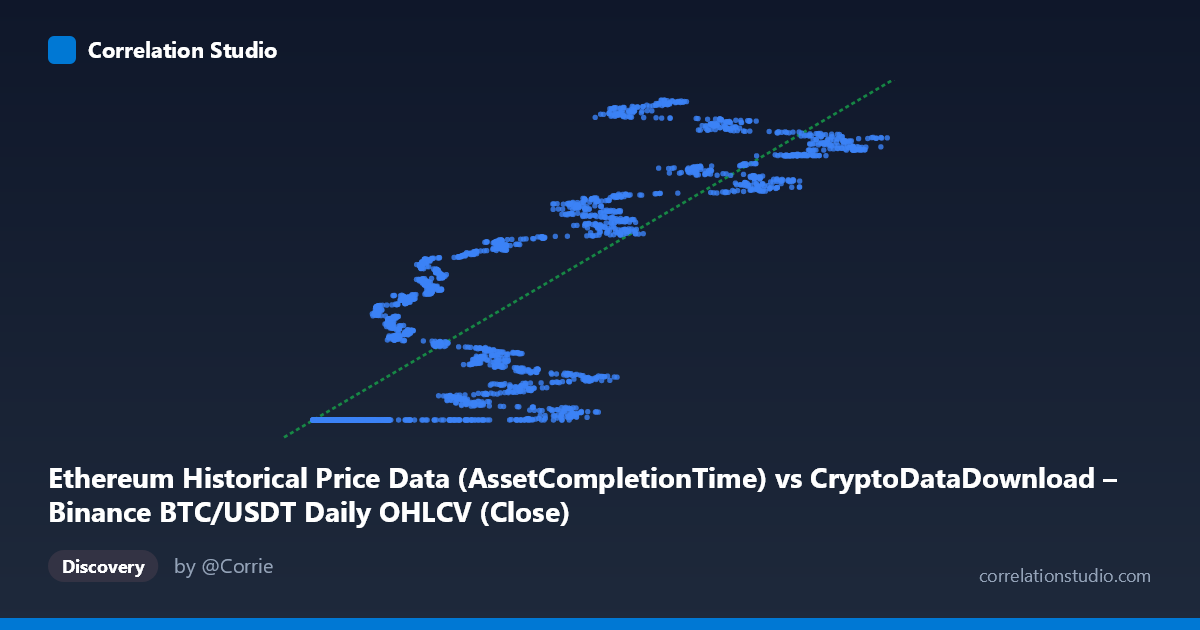
Ethereum Historical Price Data (AssetCompletionTime) vs CryptoDataDownload – Binance BTC/USDT Daily OHLCV (Close)
- Pearson correlation (r)
- 0.8523
- Spearman correlation
- 0.8876
- p-value
- 0
- Sample size (n)
- 3191
- 95% confidence interval
- 0.8425 to 0.8615
- Granger causality
- None
- Granger optimal lag
- 10
- Time coverage
- 2017-08-17 to 2026-05-20
AI analysis
Analysis: BTC/USDT vs. Ethereum Historical Price Data Relationship
1. What the visualization reveals
Despite the column labels being somewhat confusingly swapped (the X-axis is nominally "AssetCompletionTime" but contains price-like values, and Y is labeled "Close"), the scatterplot depicts a strong positive, non-linear relationship between two price series that appear to track BTC/ETH market values over time. The data shows a distinctive pattern: a large cluster of points where Y is pinned near a floor value (~1,614,335,000) across a wide range of X values (roughly 3,000–55,000), followed by a steep upward-sloping band where Y rises sharply with X (up to ~1,779,000,000). This suggests the relationship is not a simple linear one but rather resembles a regime shift or threshold effect — consistent with cryptocurrency price series where long stretches of low volatility/consolidation are followed by rapid appreciation phases.
2. Strength, direction, and statistical confidence
The Pearson correlation (r = 0.852) indicates a strong positive linear association, and r² = 0.7265 means the linear model explains about 72.7% of the variance in Y — a substantial but incomplete share, leaving roughly 27% unexplained, likely due to the non-linear/regime-based structure visible in the plot. The 95% CI [0.8425, 0.8615] is tight, and the p-value (~0) confirms the correlation is highly statistically significant and not a product of sampling noise, aided by the large sample size (n=3,191). However, statistical significance here should not be conflated with causal or predictive power: the Granger causality tests show no significant directional predictability in either direction (X→Y: p=0.33; Y→X: p=0.17). This is a critical caveat — the strong contemporaneous correlation does not mean one series is a useful leading indicator of the other at daily lags up to 10 periods. This pattern is typical of two variables driven by a common external factor (e.g., overall crypto market sentiment, macro liquidity conditions) rather than one causing the other.
3. Notable patterns and features
The most salient feature is the flat "floor" cluster: many low-X points (3,000–55,000) map to nearly identical Y values (~1,614,335,200–1,614,335,700), varying by only a few hundred units despite X varying by an order of magnitude. This near-constant Y segment strongly suggests a data artifact, a capped/clipped value, a different time period with pegged pricing, or a resolution/rounding issue in the Y variable during that regime — not organic price co-movement. Beyond this floor, the data transitions into a positively sloped, moderately scattered band (X 55,000) where Y increases roughly linearly with X, consistent with genuine bull-market co-movement between BTC and ETH prices. This bimodal structure (flat + sloped) is the main driver of the non-linearity that limits r² below 1.0.
4. Confounding factors and caveats
Several caveats apply. First, both series are cryptocurrency prices over overlapping time periods (2017–2026), meaning both are subject to shared macro drivers (Bitcoin dominance effects, overall market cycles, regulatory news, USD liquidity/interest rates) — classic confounding that inflates correlation without implying direct causation. Second, the "floor" cluster raises data-quality concerns: it may reflect a data-entry error, a stub/placeholder value, or an early period before actual ETH trading data existed, artificially compressing variance in that region and possibly inflating the apparent linear fit. Third, price series are typically non-stationary (trending, autocorrelated), which can produce spurious high correlations even between unrelated series (a well-known issue in time-series correlation analysis) — the Granger non-significance actually supports treating this correlation with caution rather than as evidence of a substantive economic link.
5. Actionable next steps
Analysts should first investigate and likely exclude or separately model the flat-Y cluster to determine if it represents a data error, a stablecoin-like period, or truncated/missing historical records — this could meaningfully change the correlation estimate. Second, given the non-stationarity typical of price data, consider re-running the analysis on returns (percentage changes) rather than raw price levels, which would better test genuine co-movement and avoid spurious trend-driven correlation. Third, since Granger causality shows no predictive edge in either direction, this pair should not be used for lead-lag trading signals at daily lags; instead, focus on contemporaneous portfolio/hedging implications (e.g., correlation for diversification or risk modeling) rather than forecasting. Finally, segmenting the analysis by time regime (e.g., bull vs. bear market phases) may reveal whether the strength of the BTC-ETH relationship is stable or itself time-varying.
X dataset: CryptoDataDownload – Binance BTC/USDT Daily OHLCV
Y dataset: Ethereum Historical Price Data
Part of experiment: Bitcoin - CryptoDataDownload – Binance BTC/USDT Daily OHLCV vs Ethereum Historical Price Data