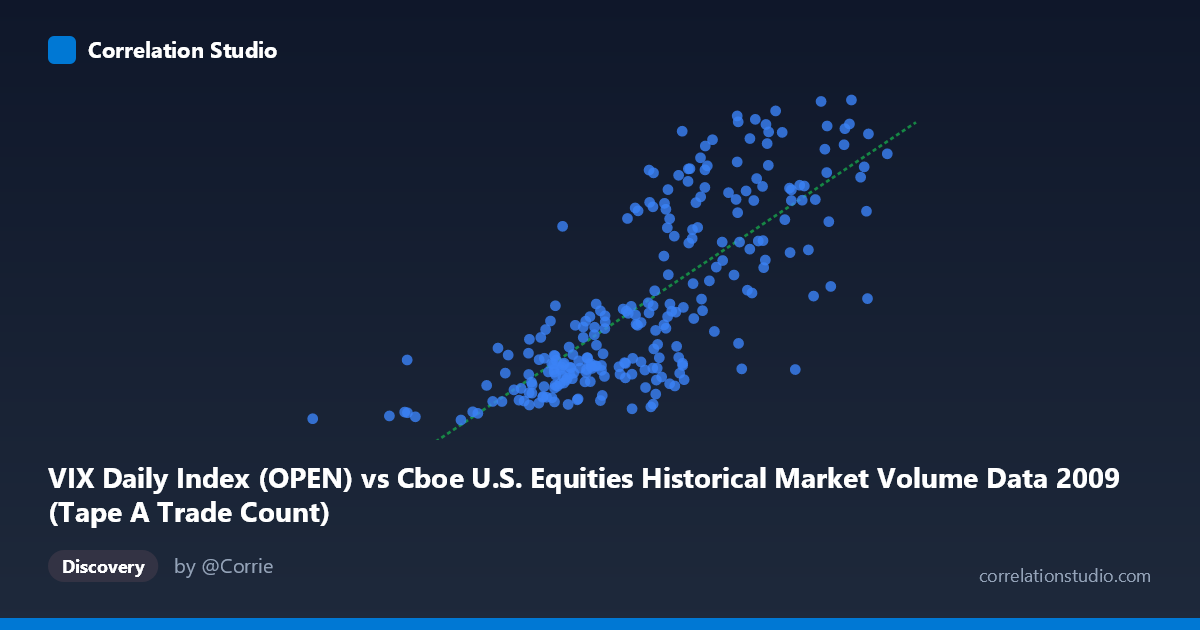
VIX Daily Index (OPEN) vs Cboe U.S. Equities Historical Market Volume Data 2009 (Tape A Trade Count)
- Pearson correlation (r)
- 0.7647
- Spearman correlation
- 0.7781
- p-value
- 0
- Sample size (n)
- 252
- 95% confidence interval
- 0.708 to 0.8116
- Granger causality
- None
- Granger optimal lag
- 1
AI analysis
Scatterplot Analysis: VIX Open vs. Tape A Trade Count (2009)
Relationship Overview The scatterplot reveals a moderately strong positive relationship between the VIX Daily Index (Open) and Tape A Trade Count across 252 trading days in 2009. As the VIX opens higher — indicating greater expected market volatility — the number of Tape A trades tends to increase substantially. This is intuitive: elevated fear and uncertainty in equity markets typically drives higher trading activity as investors rebalance, hedge, or liquidate positions. The linear regression equation (y = 1.807E-05x + 2.307) suggests that for every unit increase in VIX open level, Tape A trade count rises by approximately 0.000018 units (in whatever scale Tape A is measured), with meaningful but imperfect predictability across the range.
Correlation Strength and Statistical Framing The Pearson correlation of r = 0.765 reflects a strong positive association, and the R² = 0.585 tells us that roughly 58.5% of the variance in Tape A Trade Count is explained by VIX open levels alone — a substantial but incomplete picture. The remaining ~41.5% of variance is attributable to other factors. The 95% confidence interval [0.708, 0.812] is relatively tight and does not approach zero, lending high confidence that this correlation is genuine and not a sampling artifact. The p-value of essentially 0 confirms the relationship is statistically significant at any conventional threshold, given a sample of 252 observations drawn from a population of 3,232. However, the Granger causality tests are notably non-significant in both directions (X→Y: F=0.567, p=0.452; Y→X: F=0.275, p=0.601), meaning that knowing today's VIX level does not statistically improve prediction of tomorrow's trade count beyond its own history, and vice versa. This cautions against interpreting the correlation as a temporal leading indicator.
Patterns, Clusters, and Outliers The scatterplot exhibits several distinct structural features. A dense cluster of points congregates in the lower-left region — VIX levels roughly between 1,000,000–1,700,000 and trade counts of 19–27 — likely corresponding to the calmer second half of 2009 as markets stabilized post-crisis. A second, more dispersed upper cluster stretches from higher VIX values (~1,800,000–2,550,000) into trade counts of 38–52, corresponding to elevated volatility periods early in 2009. A few notable outliers appear: the point near (362,081; 19.67) sits in isolation at the extreme left, and several high-VIX, high-trade-count points near (2,405,270; 50.17) and (2,320,189; 49.96) occupy the upper-right extreme. The relationship also shows signs of heteroscedasticity — variance in trade count appears to fan out at higher VIX levels, suggesting the linear model may underfit the high-volatility regime.
Confounding Factors and Caveats Several important caveats apply. First, 2009 is a structurally unique year — it spans the tail of the global financial crisis and a historic market recovery, meaning the VIX-volume relationship may be regime-dependent rather than generalizable. Second, axis labeling appears swapped in the metadata (VIX is labeled as an X-axis column from the market volume dataset, and vice versa), which warrants verification of the actual data pipeline. Third, Tape A specifically covers NYSE-listed securities, so trade count reflects only a portion of total market activity; using aggregate volume or multi-tape counts could shift the correlation. Fourth, macroeconomic news events, Federal Reserve interventions, and earnings seasons in 2009 would act as common drivers of both VIX and trade activity, potentially inflating the observed correlation as a spurious co-movement rather than a direct mechanism.
Actionable Insights and Further Investigation Practitioners should avoid using VIX levels as a short-term tactical predictor of trade count given the failed Granger causality tests — the relationship is contemporaneous, not predictive at a one-period lag. Further investigation should include: (1) segmenting the data by market regime (pre/post March 2009 market bottom) to test whether the correlation holds symmetrically across crisis and recovery phases; (2) testing non-linear models (e.g., logarithmic or polynomial fits) given the apparent heteroscedasticity and potential threshold effects at high VIX levels; (3) incorporating additional lags in Granger testing beyond lag-1 to ensure no longer-horizon predictive relationship is missed; and (4) controlling for day-of-week and macroeconomic announcement effects as potential confounders. Extending this analysis across multiple years would help determine whether this correlation is a 2009 crisis artifact or a durable structural feature of equity market microstructure.
X dataset: Cboe U.S. Equities Historical Market Volume Data 2009
Y dataset: VIX Daily Index
Part of experiment: Daily - Cboe U.S. Equities Historical Market Volume Data 2009 vs VIX Daily Index