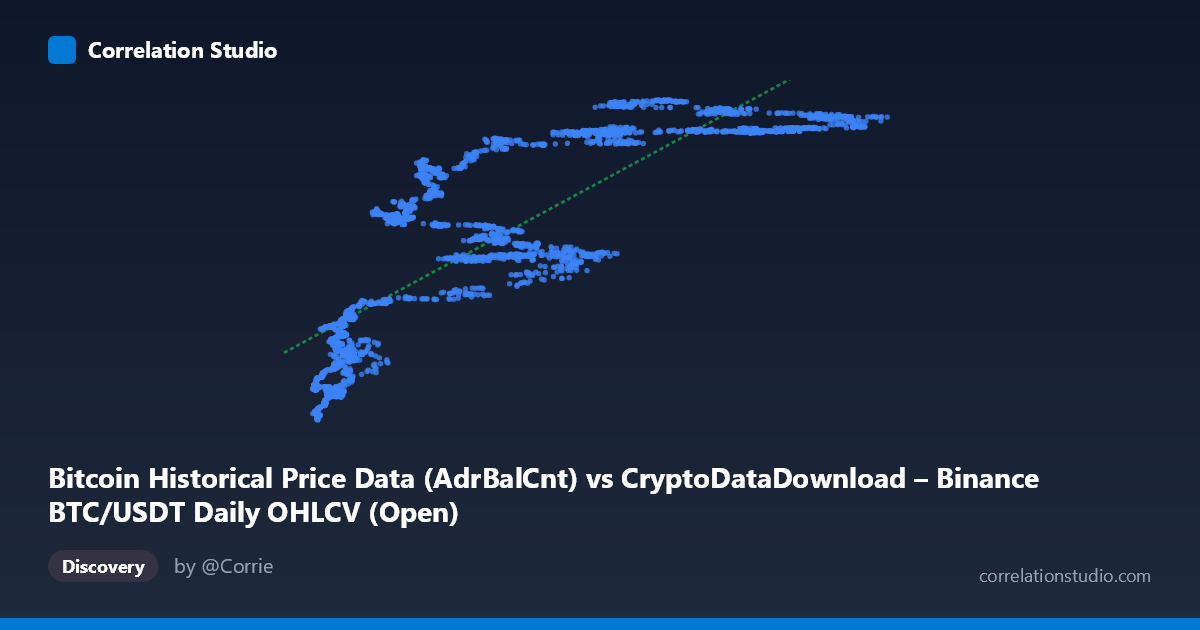
Bitcoin Historical Price Data (AdrBalCnt) vs CryptoDataDownload – Binance BTC/USDT Daily OHLCV (Open)
- Pearson correlation (r)
- 0.8284
- Spearman correlation
- 0.8985
- p-value
- 0
- Sample size (n)
- 3191
- 95% confidence interval
- 0.8172 to 0.839
- Granger causality
- Y → X
- Granger optimal lag
- 10
AI analysis
Analysis: Bitcoin Active Address Count vs. Opening Price
1. Relationship Overview
The scatterplot shows a positive, moderately strong relationship between Bitcoin's active address count (AdrBalCnt) and its opening price. As the number of active addresses increases from roughly 3,000 to over 124,000, opening prices climb from around $18.8M to $57M (scaled units). The sample points reveal a clear upward trend but with substantial dispersion around the fitted line, particularly noticeable when comparing similar X-values that yield different Y-values (e.g., addresses near 4,000–6,000 correspond to prices ranging from ~$19M to $23M).
2. Strength, Direction, and Predictive Uncertainty
The correlation coefficient (r = 0.828) indicates a strong positive linear relationship, with R² = 0.686 meaning approximately 69% of the variance in opening price is explained by network address activity — leaving roughly 31% attributable to other factors. The tight 95% confidence interval [0.817, 0.839] combined with a p-value of essentially 0 confirms this correlation is highly statistically reliable given the large sample (n=3,191), not a product of chance.
However, the Granger causality results add critical nuance: Y (price) Granger-causes X (address count), not the reverse — the Y→X test is significant (F=1.869, p=0.045) while X→Y is not (p=0.149). This suggests that price movements tend to precede changes in network activity, rather than address growth driving price. This is counterintuitive to the "network adoption drives value" narrative and instead suggests price rallies/speculation attract new addresses (potentially via new user onboarding, exchange activity, or wallet churn) rather than organic network growth causing price appreciation.
3. Notable Patterns and Non-Linearities
The data suggests a non-uniform, possibly concave/logarithmic relationship rather than pure linearity. At low address counts (3,000–15,000), price varies enormously ($19M–$48M) — indicating this region contains multiple market regimes (likely different market cycles/years) rather than a single tight cluster. At higher address counts (60,000), prices cluster more tightly in the $51M–$57M range, suggesting a possible saturation or ceiling effect. This pattern — high variance at low X, compression at high X — hints that address count alone poorly discriminates price in early/bear-market periods but becomes more informative near cycle peaks.
4. Confounding Factors and Caveats
Several caveats apply: - Temporal autocorrelation: Both series are trending time series (2017–2026 span, covering multiple bull/bear cycles), so the correlation may partly reflect a shared upward time trend rather than a direct causal mechanism. - Confounding macro variables: Halving cycles, exchange volume, regulatory news, and macroeconomic conditions (rates, inflation, ETF approvals) likely drive both variables simultaneously. - Address count ≠ unique users: Address counts can be inflated by exchange internal transfers, wallet-splitting behavior, or bot activity, decoupling it from genuine network adoption. - The Granger result, while statistically significant, has a modest F-statistic (1.869) — the predictive relationship is real but not strongly dominant.
5. Suggestions for Further Investigation
Given the Granger direction, future work should focus on price as a leading indicator for on-chain activity, testing whether price shocks predict address growth at specific lags (10-period optimal lag suggests notable delay). Analysts should also test a log-log or log-linear model given the apparent non-linear compression at high X values, which may improve R² beyond 0.686. Segmenting the data by market cycle (bull/bear phases) could reveal whether the relationship strength varies by regime, and incorporating a control variable (e.g., trading volume or realized cap) would help isolate the address-count effect from broader market momentum.
X dataset: CryptoDataDownload – Binance BTC/USDT Daily OHLCV
Y dataset: Bitcoin Historical Price Data
Part of experiment: Bitcoin - CryptoDataDownload – Binance BTC/USDT Daily OHLCV vs Bitcoin Historical Price Data