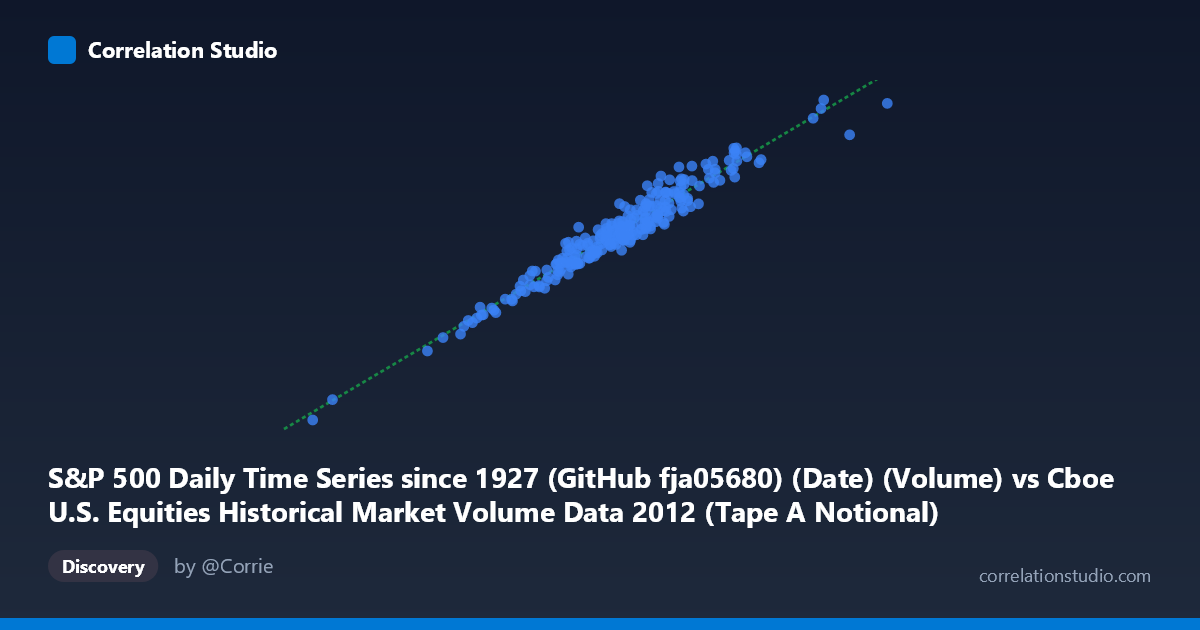
S&P 500 Daily Time Series since 1927 (GitHub fja05680) (Date) (Volume) vs Cboe U.S. Equities Historical Market Volume Data 2012 (Tape A Notional)
- Pearson correlation (r)
- 0.9729
- Spearman correlation
- 0.9601
- p-value
- 0
- Sample size (n)
- 250
- 95% confidence interval
- 0.9653 to 0.9788
- Granger causality
- Bidirectional
- Granger optimal lag
- 10
AI analysis
Analysis: S&P 500 Trading Volume vs. Cboe Tape A Notional Value (2012)
Relationship Overview
The scatterplot reveals a strikingly strong positive linear relationship between daily S&P 500 trading volume and Cboe Tape A notional value across the 2012 trading year. As total market volume increases, the notional dollar value of transactions on Tape A (NYSE-listed securities) rises in near-lockstep. The data points cluster tightly around the regression line (y = 0.509x + 1.46×10⁸), suggesting that approximately 50 cents of every dollar of notional Tape A activity corresponds to each unit increase in overall market volume — a structurally stable relationship throughout the year. The consistent slope implies that Tape A's share of total market activity remained relatively constant across varying volume regimes in 2012.
Correlation Strength and Statistical Significance
The correlation is exceptionally strong at r = 0.9729, with R² = 0.9465, meaning 94.6% of the variance in Tape A notional value is explained by total market volume — leaving only ~5.4% attributable to other factors. The 95% confidence interval [0.9653, 0.9788] is narrow, confirming this estimate is highly precise, and the p-value of effectively zero eliminates any possibility this correlation arose by chance across 250 paired observations drawn from a population of 3,750 trading days. Granger causality analysis adds meaningful nuance: bidirectional causality exists at an optimal lag of 10 periods, with nearly symmetric F-statistics (X→Y: F=2.67, p=0.0042; Y→X: F=2.66, p=0.0044). This symmetry is notable — neither variable clearly "leads" the other, suggesting both series are co-driven by a common underlying market force rather than one mechanically causing the other.
Patterns, Clusters, and Outliers
The sample points reveal a broad volume range (roughly 2.4B to 10.7B on X), with the bulk of observations clustering between 5.5B and 8.5B — consistent with typical 2012 daily trading volume. Two observations stand out as high-leverage outliers in the upper-right region: the point near (9.80B, 5.27B) and another near (9.65B, 5.04B), both substantially above the main cluster. These likely correspond to high-volatility event days (e.g., election day, major macro announcements, or quad-witching expirations). Importantly, even these extreme observations appear to fall near or on the regression line, suggesting the linear model remains valid even in tail conditions — a sign of structural robustness rather than spurious fit.
Confounding Factors and Interpretive Caveats
Several important caveats apply. First, this correlation may be largely tautological: Tape A notional value is a component of total market volume, meaning the two series share definitional overlap — correlation between a part and a whole is mathematically expected to be high. Second, the bidirectional Granger result and symmetric F-statistics suggest both variables are likely co-driven by latent factors such as macroeconomic news, VIX spikes, or Federal Reserve announcements, rather than exhibiting genuine predictive independence. Third, the 2012 sample period is a single calendar year with a specific macro regime (post-crisis recovery, QE environment), so results may not generalize across different volatility or liquidity regimes. Finally, the regression intercept (~1.46×10⁸) is non-trivial, implying a baseline notional floor even at very low volume — worth scrutinizing for minimum-activity market-making effects.
Actionable Insights and Further Investigation
Given the near-perfect co-movement, practitioners could use total market volume as a real-time proxy or leading signal for Tape A notional exposure — useful for intraday liquidity risk management or margin modeling. However, the ~5.4% unexplained variance deserves targeted investigation: decomposing residuals by day-of-week, options expiration cycles, or VIX quintile could reveal systematic patterns in when Tape A diverges from total volume expectations. It would also be valuable to replicate this analysis across multiple years (2008–2023) to test whether the 0.509 slope coefficient is stable or drifts with market structure changes (e.g., rise of dark pools, Reg NMS effects). Finally, given the 10-period Granger lag, a time-series model incorporating lagged volume (e.g., VAR or ARIMAX) could improve notional value forecasting beyond what the contemporaneous linear regression captures.
X dataset: Cboe U.S. Equities Historical Market Volume Data 2012
Y dataset: S&P 500 Daily Time Series since 1927 (GitHub fja05680) (Date)
Part of experiment: Daily - Cboe U.S. Equities Historical Market Volume Data 2012 vs S&P 500 Daily Time Series since 1927 (GitHub fja05680) (Date)