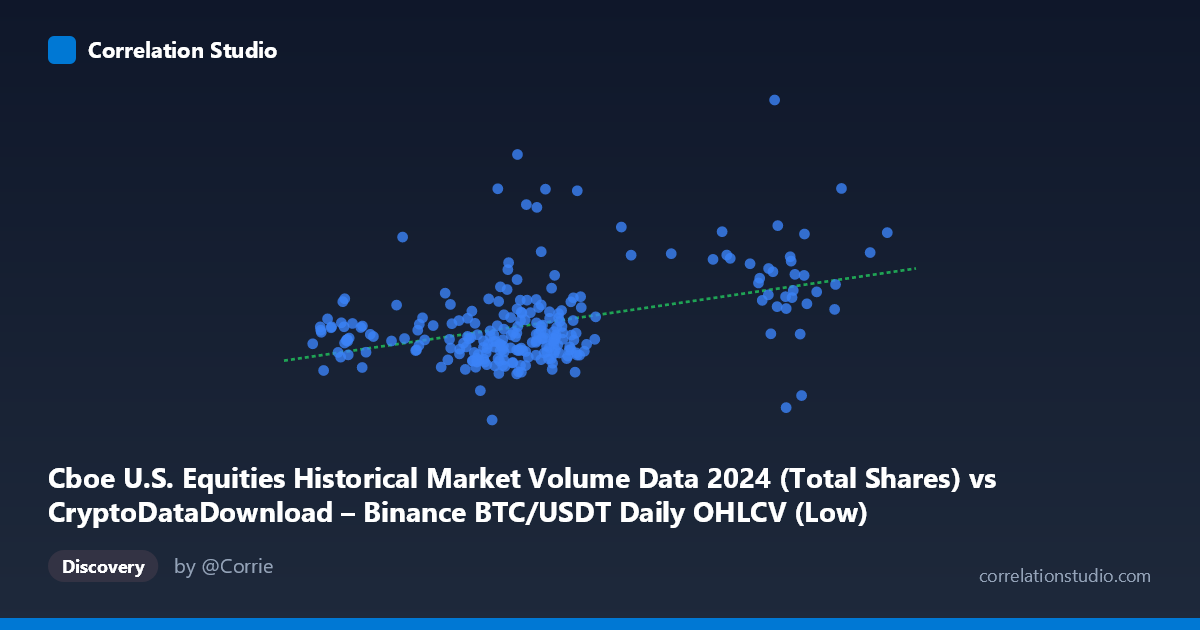
Cboe U.S. Equities Historical Market Volume Data 2024 (Total Shares) vs CryptoDataDownload – Binance BTC/USDT Daily OHLCV (Low)
- Pearson correlation (r)
- 0.4172
- Spearman correlation
- 0.3278
- p-value
- 0
- Sample size (n)
- 252
- 95% confidence interval
- 0.3096 to 0.5142
- Granger causality
- None
- Granger optimal lag
- 10
- Time coverage
- 2024-01-02 to 2024-12-31
AI analysis
Analysis: Cboe Equities Volume vs. Binance BTC/USDT Low Price
1. Relationship Overview
The scatterplot displays a positive but weak-to-moderate linear relationship between Cboe U.S. equities market volume and Binance BTC/USDT daily low prices. Most data points cluster tightly in the X range of 55,000–70,000 with corresponding Y values between roughly 500M–800M, forming a dense central cloud. A secondary, more sparse cluster appears at higher X values (93,000–105,000), suggesting distinct volume regimes—likely corresponding to different periods or market conditions during 2024 (e.g., high-volatility trading days versus calmer periods).
2. Strength, Direction, and Statistical Confidence
The correlation coefficient (r = 0.417) indicates a modest positive linear association, with R² = 0.174 meaning only 17.4% of the variance in BTC's low price is explained by equities volume—leaving over 82% attributable to other factors. The 95% CI [0.310, 0.514] is reasonably tight and excludes zero, and the extremely low p-value (4.94E-12) confirms this correlation is statistically robust and not due to chance, even though the sample size (n=252) is much smaller than the population (N=3,212), warranting some caution in generalizing precisely.
Critically, the Granger causality tests show no significant predictive direction in either direction (X→Y: p=0.174; Y→X: p=0.857). This means that despite the contemporaneous correlation, past values of one series do not meaningfully help forecast future values of the other at the tested lag (10 periods). Practically, this suggests the relationship is either coincidental, driven by a shared external factor, or operates on a different time structure than tested (e.g., simultaneous rather than lagged).
3. Notable Patterns and Outliers
Several outliers stand out: the point at (63379, 965M) and (49000, 877M) sit well above the main trend, representing days with unusually high BTC lows relative to equity volume. Conversely, (59400, 379M)—the minimum Y value—and (93569, 413M) fall far below the regression line, indicating occasional decoupling between the two markets. The higher-X cluster (93K–105K) shows more scattered Y-values (413M to 823M) with a flatter apparent slope than the main cluster, hinting at potential non-linearity or a regime change where the relationship weakens or shifts at higher equity volumes.
4. Confounding Factors and Caveats
Several confounders likely inflate or obscure the "true" relationship: both series may be driven by common macro factors (e.g., overall market risk sentiment, Fed policy announcements, quarterly options expirations) rather than a direct causal link between Cboe equity volumes and crypto prices. Additionally, BTC price has a strong underlying trend/momentum component (autocorrelation) that a simple correlation with daily equity volume doesn't capture—this could create spurious correlation if both series trended over the year. The mismatch in economic meaning (equity share volume vs. crypto dollar price) also means units and scale are not directly comparable, and calendar effects (weekday equity trading vs. 24/7 crypto trading) could introduce alignment noise.
5. Suggested Next Steps
Given the weak R² and lack of Granger causality, treating this as a tradable predictive signal is not advisable. Further investigation should: (a) test alternative lag structures (1-5 days) since the optimal lag of 10 periods may not capture same-day or short-term dynamics; (b) explore whether a third variable (e.g., VIX, overall market volatility, or trading day effects) explains both series simultaneously; (c) segment the analysis by the two apparent clusters (normal vs. high-volume regime) to check if the relationship strengthens conditionally; and (d) consider log-transforming both variables or using returns/changes rather than levels, which may reveal a cleaner relationship and reduce trend-driven spurious correlation.
X dataset: CryptoDataDownload – Binance BTC/USDT Daily OHLCV
Y dataset: Cboe U.S. Equities Historical Market Volume Data 2024
Part of experiment: Bitcoin - CryptoDataDownload – Binance BTC/USDT Daily OHLCV vs Cboe U.S. Equities Historical Market Volume Data 2024