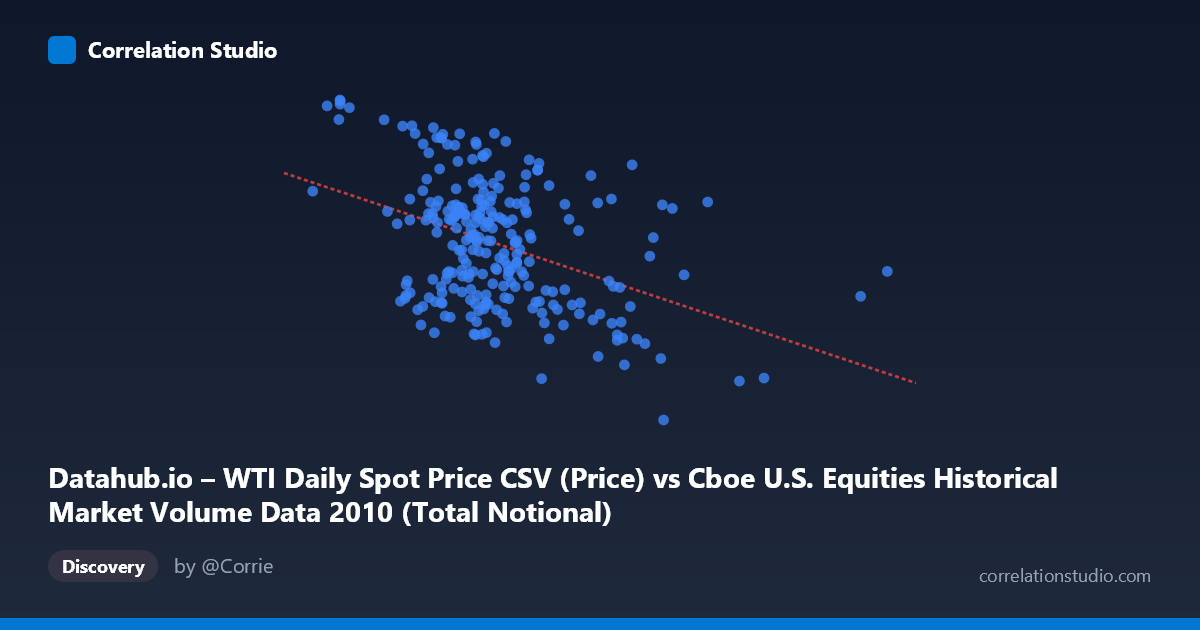
Datahub.io – WTI Daily Spot Price CSV (Price) vs Cboe U.S. Equities Historical Market Volume Data 2010 (Total Notional)
- Pearson correlation (r)
- -0.4125
- Spearman correlation
- -0.3347
- p-value
- 0
- Sample size (n)
- 252
- 95% confidence interval
- -0.51 to -0.3044
- Granger causality
- Y → X
- Granger optimal lag
- 1
AI analysis
Scatterplot Analysis: WTI Crude Oil Price vs. U.S. Equity Market Volume (2010)
Relationship Overview
The scatterplot reveals a negative relationship between U.S. equity market total notional trading volume (X-axis) and WTI crude oil daily spot price (Y-axis) across 252 trading days in 2010. As equity market volume increases, oil prices tend to be somewhat lower, and conversely, lower-volume trading days tend to coincide with higher oil prices. The linear regression equation (y = -4.13×10⁻¹⁰x + 86.98) reflects this downward slope, though the scatter around the regression line is visually substantial, suggesting the relationship is real but far from deterministic. This pairing is somewhat counterintuitive at first glance — one might expect high-activity equity markets to accompany rising commodity prices in a risk-on environment — making the statistical context especially important for proper interpretation.
Correlation Strength, Direction, and Causality
The Pearson correlation of r = -0.41 indicates a moderate negative association, but the explanatory power is modest: R² = 0.17, meaning only 17% of the variance in WTI oil prices is explained by equity trading volume. The remaining 83% of oil price variation is driven by factors entirely outside this model. The 95% confidence interval for r of [-0.51, -0.30] is entirely negative, confirming the directional finding is robust, and the p-value of 9.03×10⁻¹² leaves no doubt about statistical significance at any conventional threshold — this is not a chance finding. However, statistical significance here is partly a function of the large population context (N = 3,302), so significance should not be conflated with practical importance. The Granger causality results are particularly telling: Y Granger-causes X (F = 4.28, p = 0.040) at a 1-period lag, meaning past oil prices carry statistically useful information for predicting next-day equity volume, while the reverse (X→Y: F = 0.89, p = 0.35) is not supported. This unidirectional temporal relationship suggests oil price movements may influence trader behavior and market participation in equities, rather than the other way around.
Patterns, Clusters, and Outliers
The sample points reveal several notable structural features. There appears to be a dense central cluster roughly between X = 12–22 billion and Y = 72–88, where most trading days concentrate. Outside this core, there are conspicuous high-volume outliers — notably points near X = 42.5B (Y ≈ 75.1) and X = 34.4B (Y ≈ 68.0) — which are far to the right of the main cluster and pull the regression slope meaningfully. Similarly, low-volume, high-price days (e.g., X ≈ 8.2B, Y ≈ 90.8; X ≈ 10.6B, Y ≈ 89.8) anchor the upper-left region. These extremes are consistent with 2010 market dynamics — periods of high equity volume often coincided with volatility events (e.g., the May 2010 Flash Crash) when oil prices were under pressure, while low-volume days in calmer stretches saw oil prices drift higher. There is also a suggestion of heteroscedasticity: variance in oil prices appears somewhat wider at lower volume levels, narrowing slightly at higher volumes.
Confounding Factors and Caveats
Several important caveats apply. First, 2010 was a structurally unusual year — the global economy was in post-financial-crisis recovery, the Flash Crash occurred in May, and oil markets were responding to geopolitical and macroeconomic signals that had little to do with equity volume. Second, both variables are likely jointly driven by common macro factors such as risk appetite, economic data releases, and Federal Reserve policy, which would induce correlation without direct causation between them. Third, daily notional equity volume is itself heavily influenced by price levels of underlying stocks; as equity prices rose through 2010, notional volume would mechanically increase even without more trades — a potential confound. Fourth, the Granger causality finding, while statistically significant, uses only a 1-day lag and a bivariate framework; omitted variables (e.g., VIX, economic surprises, dollar index) could easily absorb or reverse this finding in a multivariate model. Finally, the dataset covers only one calendar year, limiting generalizability.
Actionable Insights and Further Investigation
Despite the moderate correlation, the Granger result offers a practically interesting lead: daily WTI price movements may serve as a leading indicator for next-day U.S. equity market participation, which could be relevant for exchange operators, liquidity providers, or algorithmic trading strategies. To pursue this, analysts should: (1) extend the time series beyond 2010 to test whether the relationship holds across different market regimes, including the 2014–16 oil price collapse and COVID-era volatility; (2) build a multivariate Granger model incorporating VIX, dollar index (DXY), and economic surprise indices to isolate the oil price channel; (3) examine trade count separately from notional volume to distinguish price-driven notional changes from genuine activity changes; and (4) test non-linear specifications (e.g., threshold or regime-switching models) given the visual evidence of clustering and potential heteroscedasticity. The 17% R² ceiling on a linear model suggests meaningful predictive gains may be available through richer modeling approaches.
X dataset: Cboe U.S. Equities Historical Market Volume Data 2010
Y dataset: Datahub.io – WTI Daily Spot Price CSV
Part of experiment: Daily - Cboe U.S. Equities Historical Market Volume Data 2010 vs Datahub.io – WTI Daily Spot Price CSV