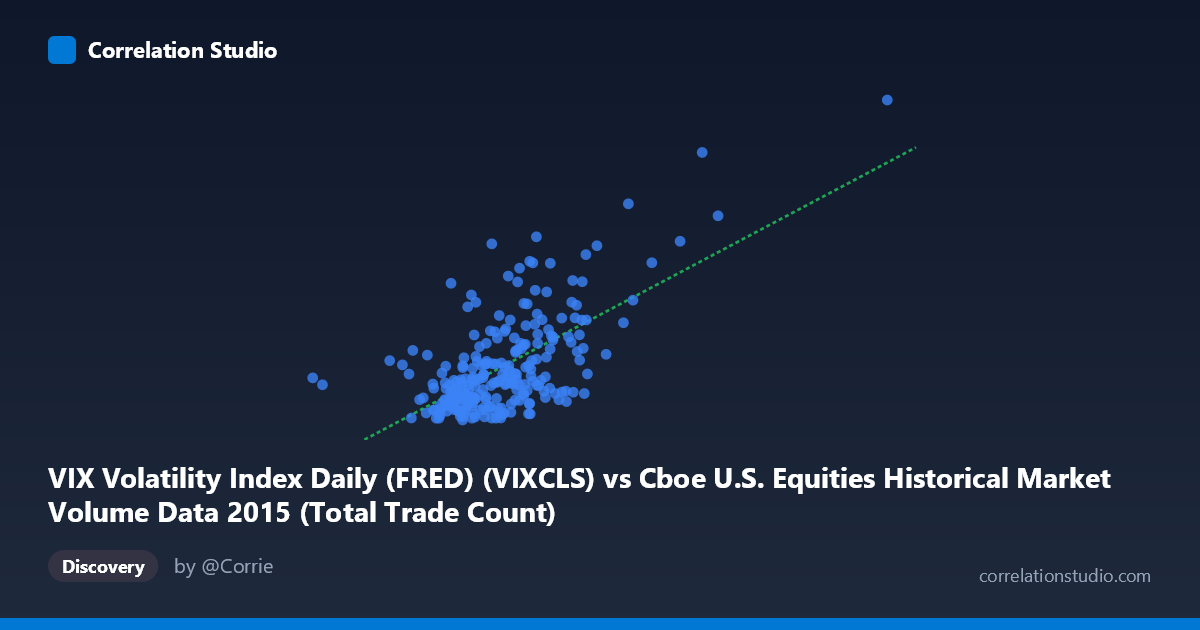
VIX Volatility Index Daily (FRED) (VIXCLS) vs Cboe U.S. Equities Historical Market Volume Data 2015 (Total Trade Count)
- Pearson correlation (r)
- 0.6459
- Spearman correlation
- 0.5266
- p-value
- 0
- Sample size (n)
- 252
- 95% confidence interval
- 0.5677 to 0.7126
- Granger causality
- None
- Granger optimal lag
- 1
AI analysis
Analysis: VIX Volatility Index vs. Total Trade Count (2015)
Relationship Overview
The scatterplot reveals a moderately positive relationship between the VIX Volatility Index and total U.S. equity trade counts throughout 2015. As the VIX rises — reflecting heightened market fear and uncertainty — the number of trades executed across U.S. equity exchanges tends to increase correspondingly. This is intuitive: periods of elevated volatility typically drive greater market participation as investors rebalance, hedge, or react to rapidly changing conditions. The linear regression equation (y = 6.02×10⁻⁶x + 1.71) confirms this positive slope, though the intercept suggests a meaningful baseline level of trading activity that persists even during calm market periods.
Correlation Strength and Statistical Significance
The correlation of r = 0.646 indicates a moderate-to-strong positive association, and the r² = 0.417 tells us that approximately 41.7% of the variance in trade count is explained by VIX levels — a practically meaningful but far from complete explanation, leaving roughly 58% of variability attributable to other factors. The 95% confidence interval of [0.568, 0.713] is relatively tight and excludes zero, and the p-value of effectively 0 (with n = 252 from a population of 3,302 trading records) confirms this relationship is highly unlikely to be a statistical artifact. However, the Granger causality results tell a more cautious story: neither X→Y (F = 0.105, p = 0.746) nor Y→X (F = 0.090, p = 0.764) showed significant temporal predictive power at a one-period lag. This means that while VIX and trade counts move together contemporaneously, knowing yesterday's VIX does not reliably predict today's trade count, and vice versa — the relationship is correlational and synchronous rather than directionally predictive in time.
Notable Patterns, Clusters, and Outliers
The sample points reveal a prominent clustering of observations in the lower-left region, approximately where VIX values fall between 1.75M–2.7M on the X-axis and trade counts between 12–16 on the Y-axis (in the units shown). This dense cluster suggests that the majority of 2015 trading days were characterized by moderate volatility and moderate activity. More striking are the high-leverage outliers in the upper-right quadrant — notably the point near (4,083,022, 36.02) and another near (3,907,921, 28.03) — which correspond to periods of extreme volatility, likely associated with the August 2015 market correction ("Flash Crash" episode). These extreme observations are influential in driving the overall correlation upward and likely have disproportionate weight in the regression fit. A small cluster of elevated trade counts at relatively modest VIX levels (e.g., around 2.4M–2.5M X-range, Y near 27) also hints at possible non-linear dynamics where trade volume surges even before VIX reaches extreme levels.
Confounding Factors and Caveats
Several important caveats temper interpretation. First, temporal autocorrelation is likely present in both series — consecutive trading days are not independent observations — which can inflate apparent correlation strength and undermine standard p-value assumptions. Second, common drivers such as scheduled macroeconomic announcements (FOMC decisions, employment reports), earnings seasons, or index rebalancing events could simultaneously spike both VIX and trade volume without one causing the other. Third, the axes appear swapped from conventional expectation (VIX is on the X-axis as a market volume dataset column, and trade count appears on the Y-axis as a VIX dataset column), suggesting a data joining artifact that should be verified before drawing firm conclusions. Finally, the relationship may be regime-dependent: the correlation could be substantially stronger during the high-volatility August period than during calm stretches, making a single linear model potentially misleading across the full year.
Actionable Insights and Further Investigation
Practitioners could explore VIX thresholds (e.g., above 20 or 25) as potential regime breakpoints, fitting separate models for calm versus stressed market environments to test whether the relationship strengthens nonlinearly during crises. A rolling correlation analysis across 2015 would reveal whether the relationship is stable or concentrated around specific event windows like the August correction. Researchers should also partial out known confounders — day-of-week effects, earnings announcement calendars, and Federal Reserve meeting dates — to isolate the genuine VIX-to-volume signal. Given the absence of Granger causality, strategies premised on using lagged VIX to predict next-day volume should be treated skeptically; instead, this relationship is better suited for contemporaneous risk modeling (e.g., estimating real-time liquidity conditions given current implied volatility). Finally, extending the analysis beyond 2015 to multi-year data would test whether this moderate correlation is a durable structural feature of U.S. equity markets or an artifact of a particularly eventful year.
X dataset: Cboe U.S. Equities Historical Market Volume Data 2015
Y dataset: VIX Volatility Index Daily (FRED)
Part of experiment: Daily - Cboe U.S. Equities Historical Market Volume Data 2015 vs VIX Volatility Index Daily (FRED)