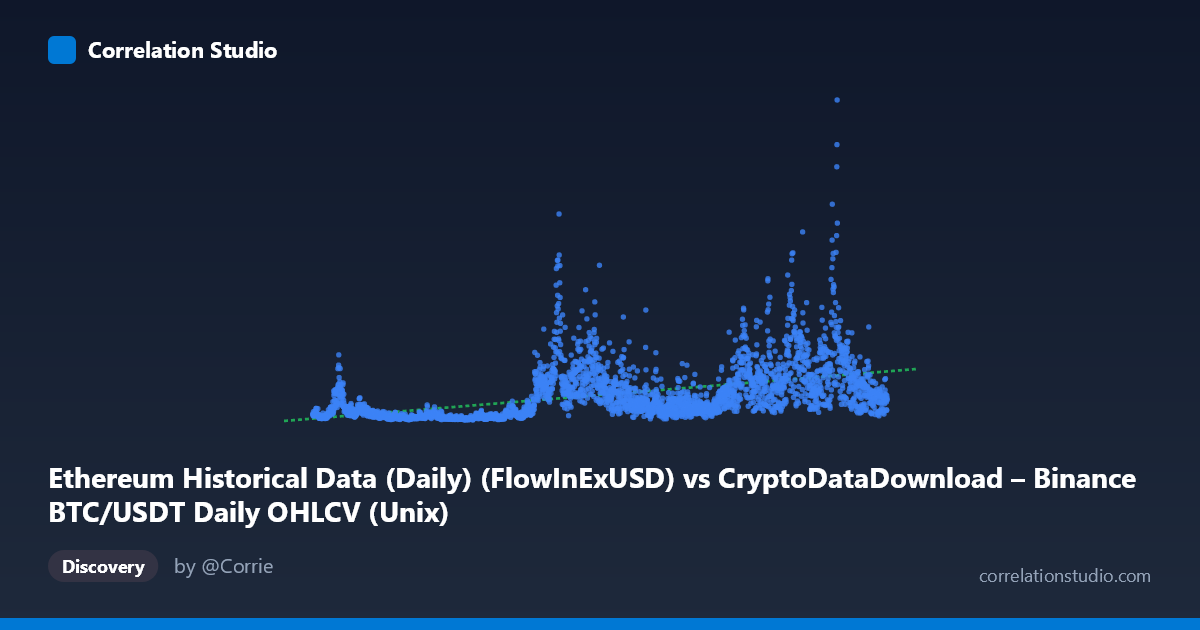
Ethereum Historical Data (Daily) (FlowInExUSD) vs CryptoDataDownload – Binance BTC/USDT Daily OHLCV (Unix)
- Pearson correlation (r)
- 0.4789
- Spearman correlation
- 0.6313
- p-value
- 0
- Sample size (n)
- 3191
- 95% confidence interval
- 0.4517 to 0.5052
- Granger causality
- None
- Granger optimal lag
- 10
AI analysis
Analysis: X-axis Metric vs. Ethereum-Related Y-axis Metric
1. What the Visualization Reveals
The scatterplot shows a moderate, positive relationship between the two variables, with values clustering broadly along an upward trend but exhibiting substantial scatter. Rather than a tight linear band, the data appears to fan out—suggesting the relationship strengthens or weakens at different points along the X range (spanning 2017–2026, based on the timestamp values). Given that the X-axis is labeled as an Ethereum flow metric but the values (1.5–1.78 trillion range) look like Unix timestamps, and the Y-axis is labeled as Binance OHLCV but values (14M–6.9B) resemble a monetary/volume flow metric, it's likely the axis labels are swapped or mismatched in metadata—the actual relationship being plotted is probably between a time-indexed metric and a financial flow/volume metric.
2. Strength, Direction, and Statistical Confidence
- Correlation strength: r = 0.479 indicates a moderate positive correlation, with R² = 0.229 meaning only ~23% of the variance in Y is explained by X. The remaining 77% is driven by other factors, noise, or non-linear dynamics not captured by this linear model. - Statistical confidence: The 95% CI [0.452, 0.505] is narrow and the p-value ≈ 0, confirming the correlation is highly statistically significant and not due to chance—but statistical significance here reflects the large sample size (n=3,191), not necessarily practical strength. - Causality: Granger causality tests show no significant predictive direction in either direction (X→Y: p=0.185; Y→X: p=0.089, only marginally suggestive). This means neither variable reliably predicts future values of the other in a time-series sense—the correlation is likely driven by shared exposure to a common underlying trend (e.g., overall crypto market cycles) rather than one variable causing the other.
3. Notable Patterns and Features
- Non-linearity flagged: The note that Spearman ρ exceeds Pearson r is important—it suggests the relationship is monotonic but not linear, likely logarithmic or power-law shaped. This is consistent with financial/blockchain data, which often spans orders of magnitude (Y ranges from ~14M to 6.9B, a 480x spread) and benefits from log-transformation before correlation analysis. - Heteroscedasticity: Sample points show low values clustering in 2019–2021 (tens of millions) and much higher, more volatile values in 2021–2025 (hundreds of millions to billions), indicating variance increases over time—a classic sign of multiplicative rather than additive relationships. - Cyclical clusters: Values spike during known crypto bull markets (e.g., late 2017, 2021, 2024) and collapse during bear markets (2019, 2022–2023), suggesting both variables are jointly driven by market-wide cycles rather than a direct causal link.
4. Confounding Factors and Caveats
- Common market driver: Both BTC and ETH metrics are likely influenced by the same macro crypto market sentiment, liquidity cycles, and regulatory events—classic confounding by a latent common cause (overall market cap/sentiment), inflating correlation without direct causation. - Metadata inconsistency: The axis labels don't match the described value ranges (timestamps vs. dollar flows), which raises concerns about data pipeline errors—this should be resolved before drawing strong conclusions. - Linear model misspecification: Since R² is low and Spearman Pearson, using a linear correlation/regression understates the true strength of association; the reported R²=0.229 may significantly underrepresent explanatory power if the true relationship is log-linear or power-law.
5. Actionable Recommendations
1. Verify and correct axis labels/metadata before further analysis—current labels appear inconsistent with the data ranges shown. 2. Re-run correlation analysis on log-transformed Y (and possibly X) to test the log-linear hypothesis; report Spearman ρ alongside Pearson r for a fuller picture. 3. Test a shared common-factor model—e.g., include a market-cap or BTC-price index as a control variable to see if the X-Y correlation shrinks toward zero (confirming confounding). 4. Segment analysis by market regime (bull vs. bear periods) to check if the relationship strength changes across cycles, since pooled correlation may mask regime-dependent dynamics. 5. Given the lack of Granger causality, avoid using one variable to forecast the other in trading/predictive models; instead, treat both as co-moving indicators of broader crypto market conditions.
X dataset: CryptoDataDownload – Binance BTC/USDT Daily OHLCV
Y dataset: Ethereum Historical Data (Daily)
Part of experiment: Bitcoin - CryptoDataDownload – Binance BTC/USDT Daily OHLCV vs Ethereum Historical Data (Daily)