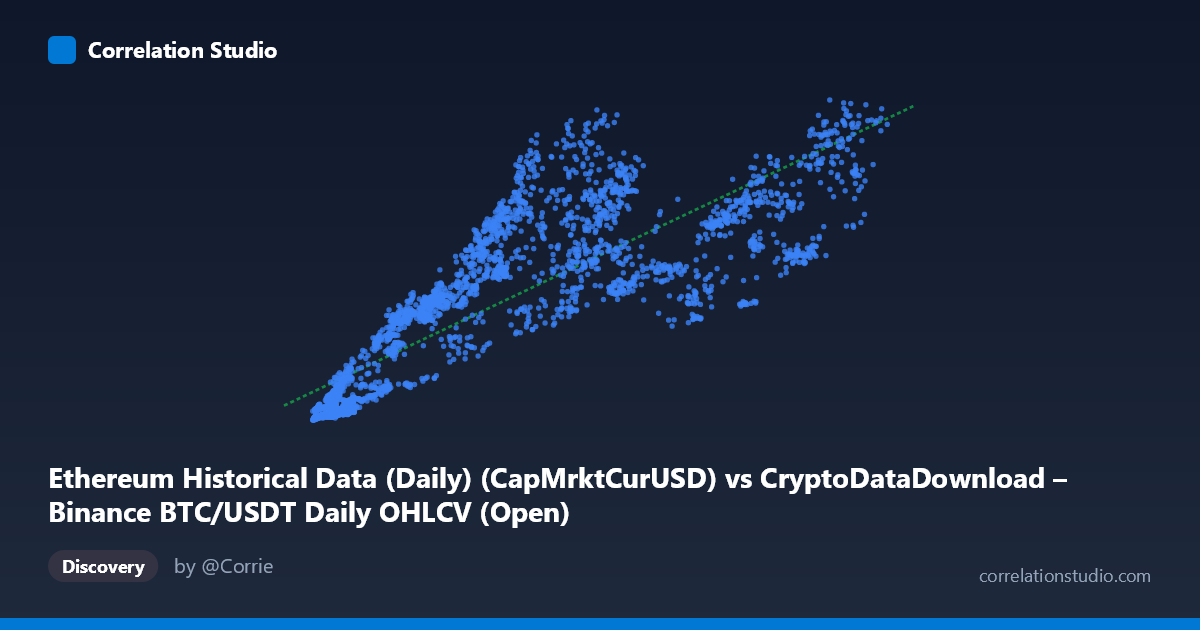
Ethereum Historical Data (Daily) (CapMrktCurUSD) vs CryptoDataDownload – Binance BTC/USDT Daily OHLCV (Open)
- Pearson correlation (r)
- 0.8477
- Spearman correlation
- 0.9127
- p-value
- 0
- Sample size (n)
- 3191
- 95% confidence interval
- 0.8376 to 0.8572
- Granger causality
- None
- Granger optimal lag
- 10
- Time coverage
- 2017-08-17 to 2026-05-20
AI analysis
Analysis: Ethereum Market Cap vs. Bitcoin Open Price
Note on labeling: The axis metadata appears swapped/mislabeled — X is described as Ethereum's market cap (CapMrktCurUSD) while Y is described as Bitcoin's opening price, but given the value ranges (X: ~3,188–124,658; Y: ~8.6B–584B), it's far more likely that X represents Bitcoin's daily Open price (in USD) and Y represents Ethereum's Current Market Cap (in USD). The analysis below proceeds on that more plausible interpretation.
1. What the Visualization Reveals The scatterplot shows a clear positive, upward-sloping relationship between Bitcoin's price and Ethereum's market capitalization. As Bitcoin's price rises from roughly $3,000 to $125,000, Ethereum's market cap climbs from single-digit billions to over $580 billion. The relationship is broadly linear but shows signs of heteroscedasticity — variance in Y widens considerably as X increases, suggesting the relationship may compress or fan out at higher price levels rather than following a perfectly uniform slope throughout.
2. Strength, Direction, and Predictive Implications With r = 0.848 and R² = 0.719, roughly 72% of the variance in Ethereum's market cap is statistically explained by Bitcoin's price — a strong relationship by most standards, though it leaves 28% of variance driven by other factors (ETH-specific news, DeFi activity, network upgrades, etc.). The tight confidence interval [0.838, 0.857] and p-value of 0 indicate this correlation is highly stable and not a artifact of sampling noise, given the large N (3,191). However, the Granger causality tests are the critical caveat: neither direction (BTC→ETH or ETH→BTC) shows significant predictive causality (p = 0.71 and p = 0.76, respectively, at 10 lags). This means that despite the strong contemporaneous co-movement, past values of one series do not reliably forecast future values of the other — the correlation reflects synchronized market behavior (likely driven by shared external factors like macro liquidity, crypto-wide sentiment, or regulatory events) rather than a lead-lag causal mechanism.
3. Notable Patterns and Outliers Several sample points reveal interesting deviations from strict linearity: at similar BTC price levels (~$8,000–11,000), ETH market cap varies dramatically — from ~$20B to over $100B (e.g., $11,250 → $102B vs. $10,624 → $31B) — suggesting distinct market regimes or bull/bear cycles at the same price point. This points to a "hysteresis" effect where the relationship depends on market cycle phase (e.g., 2017 ICO boom vs. 2021 bull run vs. later periods) rather than a static price-to-price mapping. The wide scatter at low-to-mid X values, tightening somewhat at higher X values, suggests the data captures multiple market cycles with different ETH/BTC relative valuations.
4. Confounding Factors and Caveats Both cryptocurrencies are subject to shared macro drivers — overall market sentiment, Bitcoin dominance shifts, regulatory news, and liquidity cycles — that would naturally produce correlated price action without direct causality. The time span (2017–2026) covers multiple distinct market regimes (ICO mania, DeFi summer, various bull/bear cycles), and pooling all these periods into a single correlation can mask regime-dependent relationships or create a "spurious" appearance of a stable linear trend when the underlying dynamics shifted considerably. Additionally, both series are likely non-stationary (trending) time series, which is a classic condition that inflates correlation coefficients and complicates causal inference — this is likely why Granger causality failed to find significance despite the high r.
5. Suggested Next Steps Given the non-stationarity concerns, analysts should re-run correlation and causality tests on differenced or log-returns data rather than raw levels, which often reveals a different (and more actionable) picture of lead-lag relationships. It would also be valuable to segment the analysis by distinct market cycles (bull/bear regimes) to check whether the ETH-BTC relationship is stable or regime-dependent — the sample data hints at meaningfully different ETH market caps at similar BTC prices across time. Finally, given the lack of Granger causality, this correlation should be treated as a co-movement/diversification signal rather than a forecasting tool — practitioners should not expect BTC price changes to predict future ETH market cap movements (or vice versa) based on this data alone.
X dataset: CryptoDataDownload – Binance BTC/USDT Daily OHLCV
Y dataset: Ethereum Historical Data (Daily)
Part of experiment: Bitcoin - CryptoDataDownload – Binance BTC/USDT Daily OHLCV vs Ethereum Historical Data (Daily)