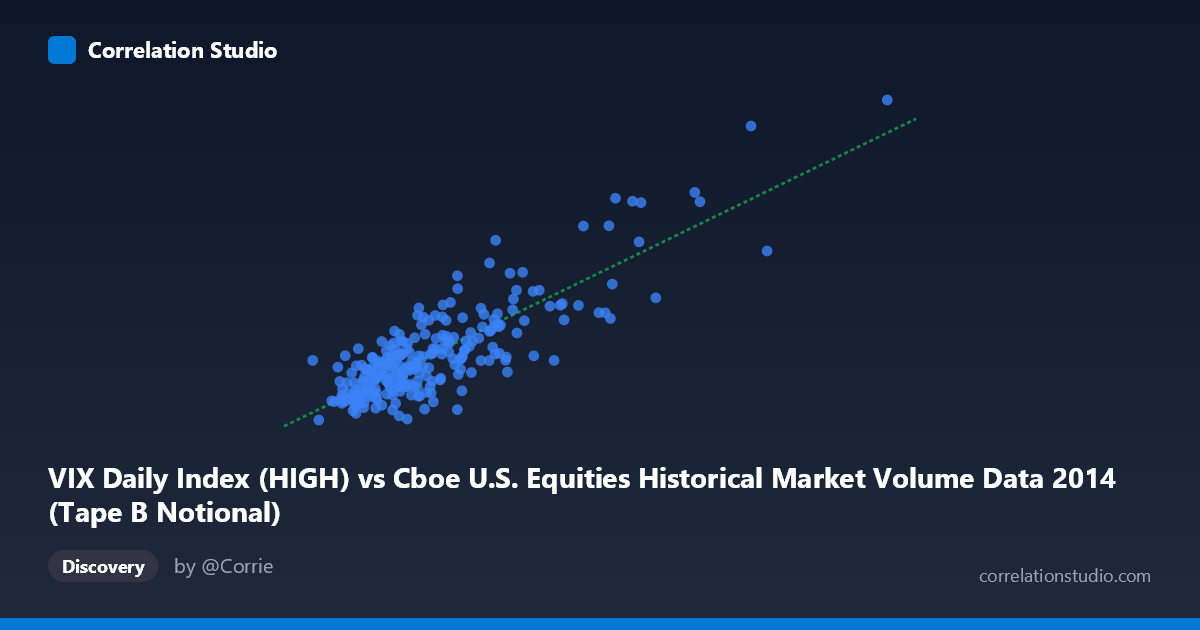
VIX Daily Index (HIGH) vs Cboe U.S. Equities Historical Market Volume Data 2014 (Tape B Notional)
- Pearson correlation (r)
- 0.8379
- Spearman correlation
- 0.7332
- p-value
- 0
- Sample size (n)
- 252
- 95% confidence interval
- 0.7968 to 0.8712
- Granger causality
- None
- Granger optimal lag
- 1
AI analysis
Scatterplot Analysis: VIX Daily Index (HIGH) vs. Tape B Notional Volume (2014)
Relationship Overview The scatterplot reveals a notably strong positive linear relationship between the VIX Daily Index High values and Cboe Tape B Notional trading volume across 2014. As VIX High readings increase, Tape B Notional values rise correspondingly, following a broadly linear trend captured by the regression equation y = 1.629×10⁻⁹x + 7.80. This makes intuitive financial sense: elevated volatility (as measured by VIX) is typically accompanied by increased trading activity, as market participants react to uncertainty by repositioning portfolios, hedging exposures, or opportunistically trading dislocations. The sample points confirm this pattern, with lower VIX-range observations clustering in the 11–15 range and higher-volume observations corresponding to VIX readings above 17–25.
Correlation Strength and Statistical Significance The Pearson correlation of r = 0.8379 is strong, and with r² = 0.7020, approximately 70.2% of the variance in Tape B Notional volume is explained by VIX High levels — a substantial explanatory share for daily financial data. The 95% confidence interval of [0.7968, 0.8712] is relatively tight and does not approach zero, affirming the robustness of the estimate across the population of N = 3,686. The p-value of effectively zero confirms this is not a chance finding given n = 252 paired observations. However, the Granger causality results are notably absent of significance in either direction (X→Y: F = 0.246, p = 0.621; Y→X: F = 0.191, p = 0.662), meaning that while the two variables are strongly contemporaneously correlated, neither reliably predicts the next period's value of the other at a lag of 1. This distinction is important: the relationship is synchronous rather than predictive, limiting its utility for forecasting one variable from the other.
Notable Patterns, Clusters, and Outliers The data exhibits a clear low-density cluster at the upper right of the chart — a small number of observations with very high VIX readings (roughly 25–31) and correspondingly elevated Tape B Notional values (above ~9 billion). These likely correspond to the acute volatility episodes of late 2014, particularly the October selloff driven by global growth concerns and Ebola fears. The bulk of observations are densely packed in the lower-left region (VIX High 10–18, Notional 11–16), reflecting the predominantly low-volatility environment of much of 2014. There also appears to be modest heteroscedasticity — variance in Y appears to widen at higher X values — and a few points (e.g., the observation near 4.86B, 11.42 and 3.76B, 11.02) fall noticeably below the regression line, suggesting occasional low-volume days despite moderate VIX levels.
Confounding Factors and Caveats Several important caveats apply. First, the axes appear to be swapped relative to the variable descriptions — the X-axis is labeled as VIX High but carries values in the billions (consistent with notional volume), while the Y-axis carries values in the 10–31 range (consistent with VIX levels). This labeling inversion should be verified before drawing firm conclusions. Second, the correlation is cross-sectional across a single calendar year (2014), so seasonal trading patterns, end-of-quarter rebalancing, and holiday-period low-volume days may confound the relationship. Third, Tape B Notional volume captures only NYSE American and regional exchange activity, not total market volume, so broader market dynamics are only partially represented. Finally, spurious correlation driven by a common third factor — such as macroeconomic news events simultaneously driving both volatility and volume — cannot be ruled out in the absence of causal identification.
Actionable Insights and Further Investigation Despite the Granger non-causality result, the contemporaneous strength of this relationship (r² ≈ 0.70) suggests it could be useful in real-time monitoring: unusually high Tape B Notional volume on a given day may serve as a corroborating signal alongside VIX for identifying stressed market conditions. Practitioners should investigate whether this relationship holds across multiple years or breaks down in different volatility regimes (e.g., 2017's historically low VIX environment vs. 2020's spike). Further analysis should test for non-linear specifications (e.g., log-log or piecewise regression) to better capture the apparent curvature at high VIX values, and should incorporate additional tape data (Tape A, Tape C) to assess whether Tape B is representative. Rolling correlation analysis over shorter windows would also clarify whether the relationship is stable throughout 2014 or concentrated in the October volatility episode.
X dataset: Cboe U.S. Equities Historical Market Volume Data 2014
Y dataset: VIX Daily Index
Part of experiment: Daily - Cboe U.S. Equities Historical Market Volume Data 2014 vs VIX Daily Index