VIX Volatility Index Daily (FRED) (VIXCLS) vs Cboe U.S. Equities Historical Market Volume Data 2015 (Tape B Shares)
- Pearson correlation (r)
- 0.7132
- Spearman correlation
- 0.556
- p-value
- 0
- Sample size (n)
- 252
- 95% confidence interval
- 0.6466 to 0.769
- Granger causality
- None
- Granger optimal lag
- 1
AI analysis
Analysis: VIX Volatility Index vs. Tape B Share Volume (2015)
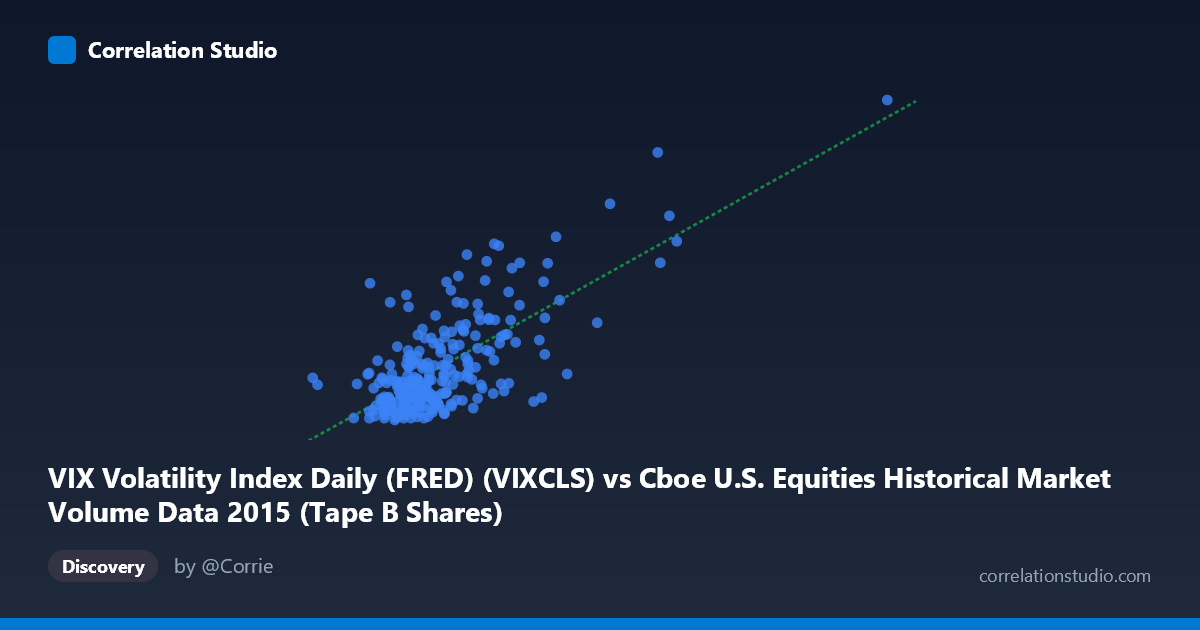
Relationship Overview The scatterplot reveals a moderately strong positive relationship between Cboe U.S. Equities market volume (Tape B Shares, on the X-axis) and the VIX Volatility Index (Y-axis) across 252 trading days in 2015. As daily share volume increases, VIX tends to rise correspondingly, which aligns intuitively with market behavior: elevated trading activity in U.S. equities is frequently associated with periods of heightened uncertainty or fear among investors. The linear regression equation (y = 1.08×10⁻⁷x + 5.51) confirms a positive slope, though the intercept and coefficient magnitudes reflect the vast scale difference between the two variables.
Correlation Strength and Statistical Significance The Pearson correlation of r = 0.713 indicates a moderately strong positive association, and the r² of 0.509 means that approximately 50.9% of the variance in VIX is explained by Tape B share volume — a substantial but far from complete explanation, leaving roughly half of VIX variance attributable to other factors. The 95% confidence interval of [0.647, 0.769] is reassuringly narrow given the sample size of 252 paired observations drawn from a population of 3,302, and the p-value of ~0 confirms this relationship is highly unlikely to be due to chance. However, despite this strong contemporaneous correlation, the Granger causality tests reveal no significant temporal predictive direction in either direction (X→Y: F=0.28, p=0.60; Y→X: F=0.07, p=0.79). This is a critical caveat: knowing yesterday's volume does not meaningfully help predict today's VIX, and vice versa. The relationship appears to be largely concurrent rather than predictive, suggesting both variables respond simultaneously to the same underlying market conditions rather than one causing the other.
Notable Patterns, Clusters, and Outliers The data exhibits a clear lower-left cluster of points concentrated around X values of 60–110 million shares and VIX values of 11–18, representing the bulk of "normal" low-volatility trading days in 2015. Beyond roughly X = 130 million, the distribution fans outward with increasing scatter, suggesting heteroscedasticity — variance in VIX increases as volume grows. Several notable outliers are visible at the upper right, including points near (205M shares, 36 VIX) and (213M shares, 28 VIX), likely corresponding to the August 2015 market correction when both volume and fear spiked dramatically. A handful of mid-range volume days (e.g., ~128M shares, VIX ~27.8) also appear elevated, hinting at episodic volatility events. The relationship also hints at a slight non-linear, convex curvature, where extreme volume days are associated with disproportionately high VIX readings.
Confounding Factors and Caveats Several important confounds complicate a causal interpretation. First, both variables are likely driven by a common third factor — market-moving news events, geopolitical shocks, or macroeconomic surprises — which simultaneously drive up both trading activity and implied volatility. Second, Tape B shares specifically cover NYSE American and regional exchanges, which may not fully represent overall market sentiment captured by VIX (derived from S&P 500 options). Third, survivorship and calendar effects (e.g., options expiration Fridays, end-of-quarter rebalancing) could inflate volume without proportionally affecting VIX. Finally, the heteroscedasticity observed at high volume levels suggests that a linear model may be suboptimal, and the r² could be artificially inflated by a small number of extreme-event days dominating the regression fit.
Actionable Insights and Further Investigation Practitioners should be cautious about using volume alone as a VIX predictor given the absence of Granger causality. However, the strong contemporaneous correlation suggests that intraday volume spikes could serve as a real-time signal of volatility regime changes rather than a leading indicator. For further investigation, it would be valuable to: (1) test non-linear models (e.g., log-log or polynomial regression) to better capture the convex tail behavior; (2) segment the data by volatility regime (e.g., pre- and post-August 2015 correction) to examine whether the correlation holds across different market environments; (3) incorporate additional variables such as VIX term structure, put/call ratios, or market breadth to improve explanatory power beyond the current 50.9%; and (4) extend the time horizon beyond a single calendar year to test whether this relationship is stable across different market cycles or is peculiar to 2015's volatility environment.
X dataset: Cboe U.S. Equities Historical Market Volume Data 2015
Y dataset: VIX Volatility Index Daily (FRED)
Part of experiment: Daily - Cboe U.S. Equities Historical Market Volume Data 2015 vs VIX Volatility Index Daily (FRED)