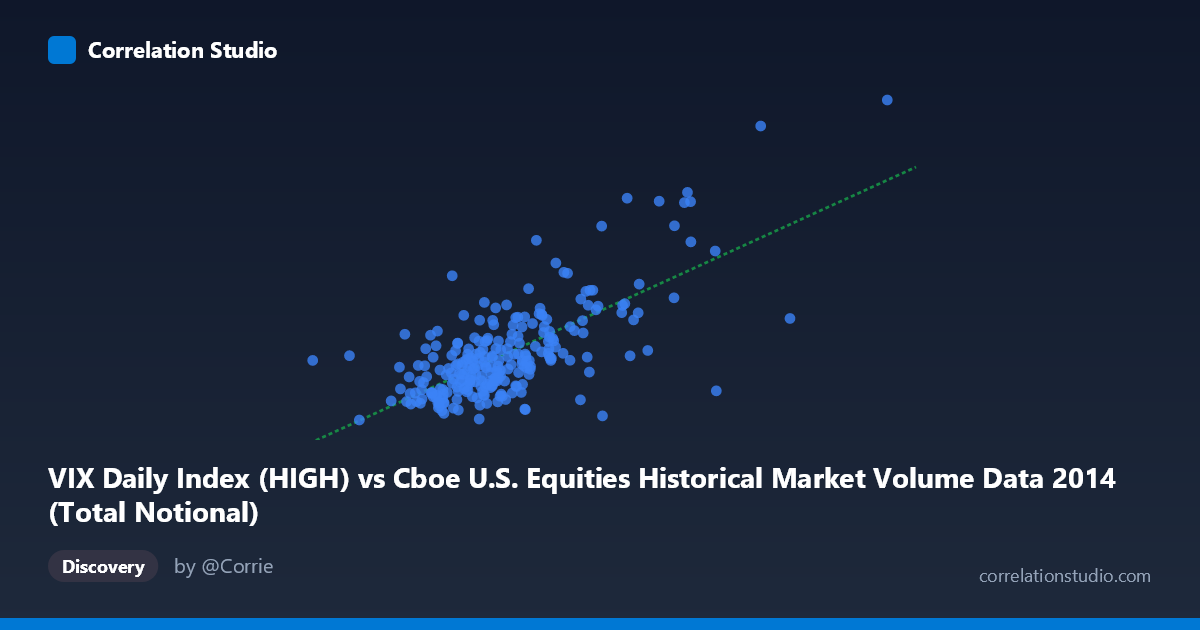
VIX Daily Index (HIGH) vs Cboe U.S. Equities Historical Market Volume Data 2014 (Total Notional)
- Pearson correlation (r)
- 0.706
- Spearman correlation
- 0.5922
- p-value
- 0
- Sample size (n)
- 252
- 95% confidence interval
- 0.6381 to 0.763
- Granger causality
- None
- Granger optimal lag
- 1
AI analysis
Scatterplot Analysis: VIX Daily Index (HIGH) vs. Total Notional Volume (2014)
Overall Relationship The scatterplot reveals a moderate-to-strong positive relationship between the CBOE VIX Daily Index High values and total notional trading volume in U.S. equities markets throughout 2014. As the VIX High increases, total notional volume tends to rise correspondingly, which aligns intuitively with market dynamics: elevated volatility typically drives heightened trading activity as investors rebalance, hedge, or react to uncertainty. The linear regression equation (y = 5.51367E-10x + 5.14) captures this upward trend, though the scatter around the regression line suggests the relationship is real but imperfect, with considerable noise at moderate VIX levels.
Correlation Strength and Statistical Significance The Pearson correlation of r = 0.706 indicates a moderately strong positive association, but the explanatory power is more sobering: r² = 0.4984 means that approximately 49.8% of the variance in total notional volume is explained by VIX High values, leaving roughly half the variance attributable to other factors. The 95% confidence interval for r [0.638, 0.763] is relatively tight and does not include zero, and the p-value of effectively zero (across n = 252 paired observations drawn from a population of N = 3,686) confirms the relationship is highly statistically significant and unlikely to be a chance artifact. However, the Granger causality results complicate the narrative considerably: neither direction of temporal causality is significant (X→Y: F = 0.69, p = 0.407; Y→X: F = 0.057, p = 0.812). This means that while the contemporaneous correlation is robust, past values of VIX do not reliably predict future notional volume — and vice versa — suggesting the two variables move together in real time rather than one systematically leading the other.
Notable Patterns, Clusters, and Outliers Several structural features stand out in the data. The bulk of observations cluster in the lower-left region, where VIX High values fall roughly between 10–18 and notional volume between 12–17 billion, reflecting typical low-volatility trading conditions that dominated much of 2014. A distinct secondary cluster emerges at higher VIX values (approximately 25–31), corresponding to elevated notional volumes (20–30+ billion), likely reflecting the market stress episodes of mid-October 2014. A small number of points appear as potential outliers — notably one observation near (22.9B notional, VIX ~11), which bucks the trend by showing very low volatility despite high volume, and the extreme upper-right point near (31.8B notional, VIX ~31), which represents the most extreme joint reading. The data distribution appears somewhat bimodal, with a gap between the calm-market cluster and the stress-event cluster, hinting at regime-switching behavior rather than a smooth continuum.
Confounding Factors and Interpretive Caveats Several important caveats apply. First, simultaneity bias is a concern: both VIX and notional volume may be jointly driven by exogenous macro events (e.g., Federal Reserve announcements, geopolitical shocks, earnings seasons) rather than one causing the other — consistent with the null Granger causality results. Second, the axis labels appear transposed in the metadata (VIX is listed on the X-axis from the Cboe Volume dataset, and Total Notional is on the Y-axis from the VIX dataset), which warrants verification of the data join logic to ensure variables are correctly attributed. Third, 2014 was a largely low-volatility year with one sharp spike in October, meaning the correlation may be heavily influenced by a small number of high-leverage observations from that stress episode — if those points were removed, the r value could deteriorate substantially. Finally, daily data introduces potential autocorrelation in both series, which can inflate apparent statistical significance.
Actionable Insights and Further Investigation Practitioners can draw several practical conclusions. The relationship supports using VIX as a rough contemporaneous signal of trading volume intensity, which could inform exchange capacity planning, market-making inventory sizing, or transaction cost estimation under varying volatility regimes. However, the lack of Granger causality means VIX High values should not be used as a standalone leading indicator for the next day's volume. Further investigation should include: (1) regime-segmented analysis separating calm-market days from stress days to assess whether the correlation holds within each regime; (2) multivariate modeling incorporating additional predictors such as S&P 500 returns, options expiration calendars, and macroeconomic announcement schedules; (3) replication across multiple years to determine whether this relationship is stable or a 2014-specific artifact; and (4) examination of non-linear models (e.g., piecewise regression or threshold models) given the apparent bimodal clustering visible in the scatterplot.
X dataset: Cboe U.S. Equities Historical Market Volume Data 2014
Y dataset: VIX Daily Index
Part of experiment: Daily - Cboe U.S. Equities Historical Market Volume Data 2014 vs VIX Daily Index