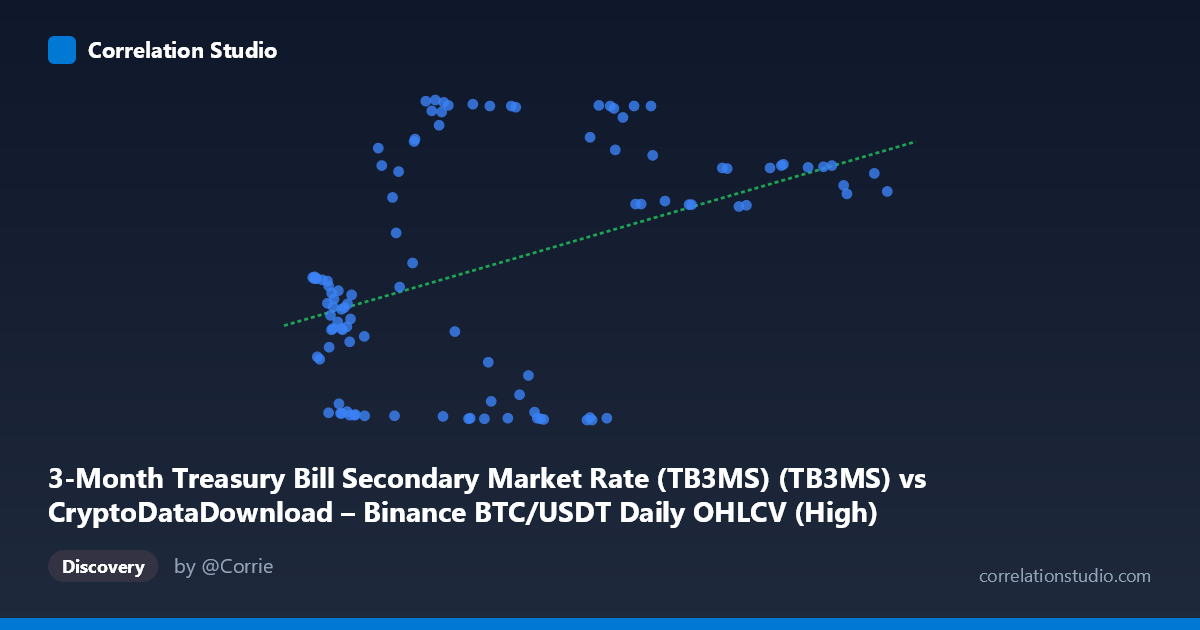
3-Month Treasury Bill Secondary Market Rate (TB3MS) (TB3MS) vs CryptoDataDownload – Binance BTC/USDT Daily OHLCV (High)
- Pearson correlation (r)
- 0.4221
- Spearman correlation
- 0.3285
- p-value
- 0.000007
- Sample size (n)
- 106
- 95% confidence interval
- 0.2516 to 0.5672
- Granger causality
- Y → X
- Granger optimal lag
- 1
AI analysis
Analysis: TB3MS Rate vs. BTC/USDT Daily High
1. What the Visualization Reveals
The scatterplot shows a weak-to-moderate positive relationship between the 3-Month Treasury Bill rate (X-axis) and BTC/USDT price highs (Y-axis). Rather than a clean linear trend, the data shows substantial scatter with values clustering into distinguishable bands—low BTC values (~0.0–0.2) appear across a wide range of T-bill rates, while high BTC values (~4.0–5.3) also span a broad rate range. This suggests the relationship is not a simple proportional one but may reflect regime-based behavior tied to the broader time period covered (2017–2026), during which both interest rates and BTC prices moved through very different macro cycles (near-zero rates in 2020–21, aggressive Fed hikes in 2022–23).
2. Strength, Direction, and Statistical Uncertainty
The correlation coefficient (r = 0.419) indicates a modest positive linear association, and r² = 0.176 tells us that only about 17.6% of the variance in BTC price highs is explained by T-bill rates—leaving over 80% of the variance driven by other factors. The 95% confidence interval [0.247, 0.565] is reasonably tight and entirely positive, and the p-value (8.6×10⁻⁶) confirms this correlation is highly unlikely to be due to chance. However, statistical significance here reflects reliable detection of a weak relationship, not a strong predictive one—practically, T3MS rate alone is a poor standalone predictor of BTC price levels. Critically, the Granger causality tests show no significant predictive direction: X→Y is far from significant (p = 0.599), and Y→X is only marginally suggestive (p = 0.070, below conventional thresholds). This means neither variable reliably "leads" the other in a temporal forecasting sense at the tested lag—the correlation is likely coincidental co-movement or driven by shared external trends rather than a causal or lead-lag mechanism.
3. Notable Patterns and Outliers
Several features stand out: - Low-BTC cluster near mid-range rates: Points like (19888, 0.09), (29600, 0.08), (49156, 0.04), (49790, 0.03) show BTC highs near zero across X-values from ~20,000 to ~50,000, suggesting a distinct period (likely 2022–23 bear market) where rates were rising sharply while BTC collapsed. - High-BTC cluster at both low and high X: Values like (65659, 5.05), (28065, 5.34), (26156, 5.32) show BTC near peak levels at moderate rates, while (67900, 5.24), (71288, 5.24), (60841, 5.25) show similarly high BTC values at elevated rates—indicating BTC highs occurred across different rate regimes. - No clear monotonic trend: The mixture of high-BTC/low-rate and high-BTC/high-rate points, plus low-BTC/mid-rate points, points to a non-linear or cyclical relationship rather than a straight-line one, consistent with the low r².
4. Confounding Factors and Caveats
This analysis conflates a macro policy variable (short-term interest rates) with a speculative asset price series across a long, structurally varied time span. Major caveats include: - Non-stationarity: Both series likely trend over time (rates rose from near-zero to 5%+; BTC has its own multi-year bull/bear cycles), which can produce spurious correlation even without causal linkage. - Omitted variables: Broader risk appetite, inflation expectations, dollar strength, crypto-specific regulatory news, and liquidity conditions are far more likely direct drivers of BTC price than T-bill rates alone. - Temporal aggregation mismatch: Daily BTC data paired with monthly T-bill rates introduces averaging/alignment artifacts. - Sampling: Only 105 of 1,109 population points are used, and every-2nd sampling in the shown data may not fully represent clustering or leverage points in the full dataset.
5. Actionable Insights and Further Investigation
Given the weak r² and lack of Granger causality, T3MS should not be used as a standalone predictor of BTC price levels. Instead, researchers should: (1) test for cointegration or run the analysis on differenced/detrended series to remove spurious trend-driven correlation; (2) include additional macro covariates (real yields, DXY index, equity risk premiums) in a multivariate model; (3) segment the analysis by distinct rate regimes (zero-rate era vs. hiking cycle) to check if the relationship is regime-dependent rather than continuous; and (4) explore longer or multiple lag structures in Granger tests, since the marginal Y→X result (p=0.070) hints at a possible weak reverse relationship worth exploring with more data or different lag windows.
X dataset: CryptoDataDownload – Binance BTC/USDT Daily OHLCV
Y dataset: 3-Month Treasury Bill Secondary Market Rate (TB3MS)
Part of experiment: Bitcoin - CryptoDataDownload – Binance BTC/USDT Daily OHLCV vs 3-Month Treasury Bill Secondary Market Rate (TB3MS)