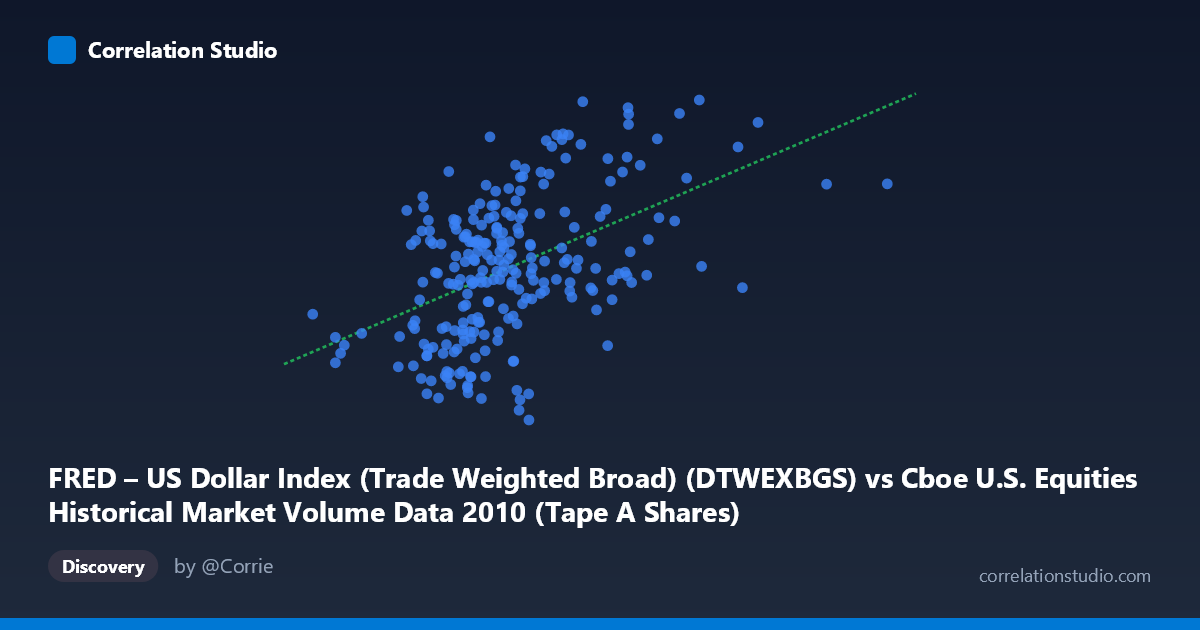
FRED – US Dollar Index (Trade Weighted Broad) (DTWEXBGS) vs Cboe U.S. Equities Historical Market Volume Data 2010 (Tape A Shares)
- Pearson correlation (r)
- 0.4837
- Spearman correlation
- 0.4518
- p-value
- 0
- Sample size (n)
- 245
- 95% confidence interval
- 0.3815 to 0.5743
- Granger causality
- None
- Granger optimal lag
- 1
AI analysis
Scatterplot Analysis: US Dollar Index vs. Cboe Equity Market Volume (2010)
Relationship Overview
The scatterplot reveals a positive, moderately weak relationship between US equity market trading volume (notional value, X-axis) and the Trade-Weighted Broad US Dollar Index (Y-axis) across 245 trading days in 2010. As daily equity market volume increases, the dollar index tends to be somewhat higher, though the scatter is considerable. The linear regression equation (y = 8.361E-09x + 89.91) suggests that each additional ~120 million units of notional volume is associated with roughly a 1-point rise in the dollar index — a modest but non-trivial slope given the variable ranges involved. The overall visual impression is of a loose cloud with a discernible upward tilt, rather than a tight linear band, indicating that while a tendency exists, volume alone is a poor predictor of dollar strength on any given day.
Correlation Strength, Explained Variance, and Causality
The Pearson correlation of r = 0.484 is statistically significant (p = 8.88E-16), confirming the relationship is unlikely due to chance given the sample size of 245. However, r² = 0.234 means only 23.4% of the variance in the dollar index is explained by trading volume, leaving over three-quarters of variation unaccounted for. The 95% confidence interval for r [0.382, 0.574] is meaningfully above zero but notably wide, reflecting genuine uncertainty about the true population relationship. Critically, the Granger causality tests reveal no statistically significant directional predictive relationship in either direction — X→Y yields F = 0.098 (p = 0.755) and Y→X yields F = 3.033 (p = 0.083), both failing conventional significance thresholds. This means that neither variable reliably predicts the other's future values at a 1-day lag, strongly cautioning against any causal interpretation of the correlation.
Patterns, Clusters, and Outliers
Several notable structural features appear in the data. The volume distribution is right-skewed, with most observations clustering between roughly 250M–550M on the X-axis, while a handful of high-volume days extend toward 700M–900M. At the high-volume extreme, points like (696M, 92.53) and (812M, 95.30) show divergent dollar index values, suggesting high-volume days are not uniformly associated with high dollar readings. The dollar index values between 89–91 appear predominantly at lower-to-mid volume levels, forming a loose lower cluster, while values above 95–97.5 appear scattered across a wide volume range, including both moderate (~478M) and high (~638M) volume days. A few potential outliers — particularly the observation near (138M, 91.20) representing an unusually low-volume day — sit isolated from the main cloud and may warrant individual examination.
Confounding Factors and Interpretive Caveats
The most important caveat is that both variables are likely driven by common macroeconomic forces rather than each other directly. In 2010, global risk sentiment, the European sovereign debt crisis, Federal Reserve quantitative easing expectations, and earnings cycles all simultaneously influenced both equity trading activity and dollar demand. High-uncertainty or risk-off periods tend to boost dollar safe-haven demand and equity volatility-driven volume, creating spurious co-movement. Additionally, the dataset covers only one calendar year (2010), limiting generalizability — this was an unusual post-crisis period with structurally elevated volumes and a dollar recovering from multi-year lows. The axis label metadata also appears transposed in the dataset descriptions (X-axis notes describe FRED data, Y-axis notes describe Cboe data), which warrants verification before drawing firm conclusions. Seasonal patterns within 2010 (e.g., summer doldrums vs. Q4 activity) may also be generating spurious clustering.
Actionable Insights and Further Investigation
Given the modest explained variance and absent Granger causality, practitioners should avoid using trading volume as a standalone predictor of dollar index movements for tactical trading or hedging decisions. However, the correlation's existence suggests value in exploring multivariate models that incorporate volume alongside VIX (volatility index), risk-on/risk-off indicators, and Fed communication events to better disentangle the shared drivers. It would be worthwhile to test whether the relationship holds across multiple years (the broader dataset spans to present day) or is specific to the 2010 post-crisis environment. Examining sector-specific volume (e.g., financials vs. technology) might reveal which market segments drive the dollar-volume linkage most strongly. Finally, testing longer Granger lags (2–5 days) could uncover delayed predictive relationships not captured at the 1-period optimal lag identified here.
X dataset: Cboe U.S. Equities Historical Market Volume Data 2010
Y dataset: FRED – US Dollar Index (Trade Weighted Broad)
Part of experiment: Daily - Cboe U.S. Equities Historical Market Volume Data 2010 vs FRED – US Dollar Index (Trade Weighted Broad)