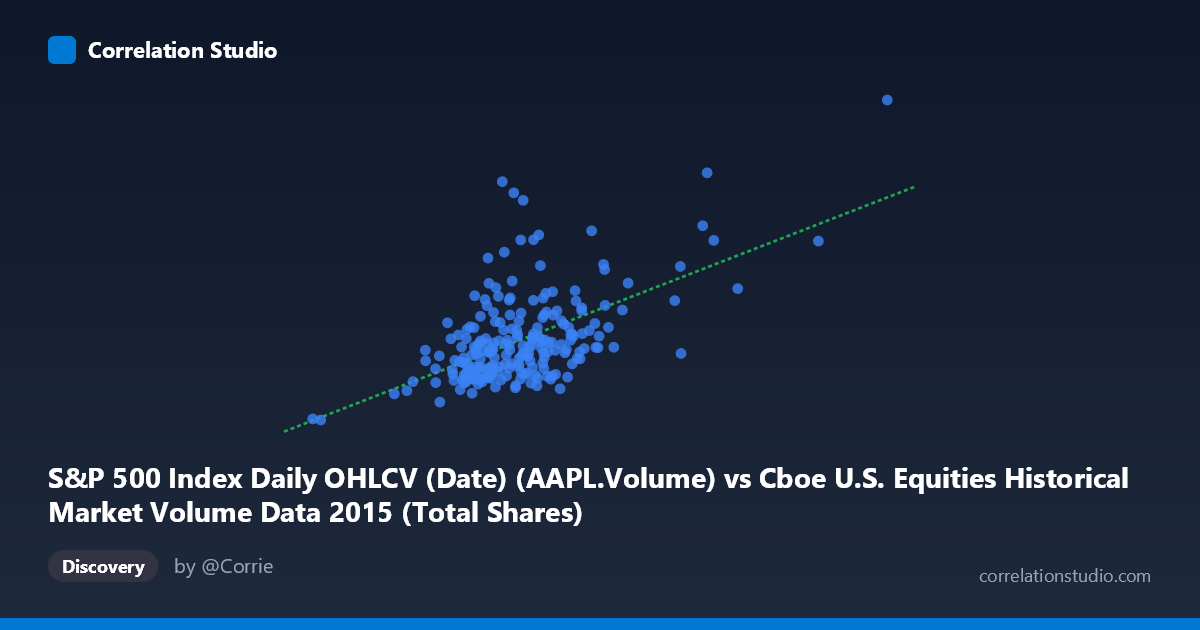
S&P 500 Index Daily OHLCV (Date) (AAPL.Volume) vs Cboe U.S. Equities Historical Market Volume Data 2015 (Total Shares)
- Pearson correlation (r)
- 0.5747
- Spearman correlation
- 0.4735
- p-value
- 0
- Sample size (n)
- 222
- 95% confidence interval
- 0.4793 to 0.6567
- Granger causality
- None
- Granger optimal lag
- 10
AI analysis
Scatterplot Analysis: AAPL Trading Volume vs. Cboe Total Market Shares (2015)
Relationship Overview The scatterplot reveals a moderately positive relationship between Apple Inc.'s daily trading volume (X-axis, from S&P 500 OHLCV data) and Cboe U.S. total equity market shares traded (Y-axis). As AAPL volume increases, total market volume tends to rise as well, consistent with the linear regression equation y = 0.117x − 11.5M. This directional alignment is intuitive: AAPL is among the most heavily traded U.S. equities, and periods of elevated market-wide activity naturally coincide with heightened activity in individual large-cap names. However, the scatter around the regression line is considerable, indicating the relationship is real but far from deterministic.
Correlation Strength and Statistical Framing The Pearson correlation of r = 0.575 indicates a moderate positive association, but the coefficient of determination (r² = 0.330) is the more important practical measure: only 33% of the variance in total Cboe market shares is explained by AAPL volume alone. The remaining 67% is attributable to other factors entirely. The 95% confidence interval [0.479, 0.657] is reasonably tight and does not approach zero, and the p-value of effectively 0 confirms this correlation is highly statistically significant across the 222 paired observations. That said, statistical significance should not be conflated with explanatory power — the modest r² makes clear that AAPL volume is a partial, not dominant, predictor. Critically, Granger causality tests find no significant temporal predictive direction in either direction (X→Y: F=1.35, p=0.205; Y→X: F=0.75, p=0.673), meaning neither series reliably predicts the other in lagged time-series terms. This undermines any causal narrative and suggests the correlation reflects shared contemporaneous drivers rather than a lead-lag relationship.
Notable Patterns, Clusters, and Outliers The bulk of the data clusters in a relatively compact region — AAPL volumes between roughly 400M–650M shares and total market shares between 25M–75M — forming a loose but discernible upward trend. However, three prominent outliers substantially distort the picture: the point near (1,092M, 162M) represents an extreme high-volume day for both series; the point near (499M, 124M) shows unusually high market volume relative to a moderate AAPL volume; and the point near (808M, 104M) similarly deviates from the central cluster. These outliers likely correspond to specific market events (e.g., earnings announcements, macro volatility days, or index rebalancing events in 2015) and exert disproportionate leverage on the regression slope and correlation coefficient. The lower-left point near (220M, 13M) — likely corresponding to a holiday-shortened or otherwise anomalous trading session — is equally influential as an extreme low.
Confounding Factors and Caveats Several confounding factors complicate interpretation. First, both variables share a common driver: broad market volatility and investor sentiment simultaneously elevate all trading volumes, creating a spurious correlation independent of any direct link between AAPL and aggregate activity. Second, the dataset conflation appears noteworthy — the axis labels indicate the datasets may have been partially swapped (AAPL volume is labeled as originating from the Cboe dataset and vice versa), raising data pipeline questions worth verifying. Third, the time coverage (February–December 2015) captures a specific macro environment including the August 2015 market correction, which likely generates some of the extreme outliers and may inflate the correlation beyond what would be observed in calmer periods. Finally, the linear model may be a poor functional form — the outlier structure and variance heterogeneity suggest the true relationship may be non-linear or regime-dependent.
Actionable Insights and Further Investigation Given the moderate correlation, significant unexplained variance, and absent Granger causality, AAPL volume should not be used as a standalone predictor of total market activity. Recommended next steps include: (1) removing or robustly analyzing the three extreme outliers to assess their influence on r and the regression slope; (2) testing non-linear models (e.g., log-log transformation) to better capture potential multiplicative relationships; (3) incorporating additional high-volume large-cap names (MSFT, AMZN, GOOGL) to build a composite volume index with stronger explanatory power; (4) aligning the analysis with the VIX or realized volatility to test whether market stress is the true common driver; and (5) verifying the dataset column attribution, as the apparent axis-label swap between data sources could indicate a preprocessing error that would affect all downstream conclusions.
X dataset: Cboe U.S. Equities Historical Market Volume Data 2015
Y dataset: S&P 500 Index Daily OHLCV (Date)
Part of experiment: Daily - Cboe U.S. Equities Historical Market Volume Data 2015 vs S&P 500 Index Daily OHLCV (Date)