Bitcoin Historical Data (2010-2024) (TxTfrCnt) vs CryptoDataDownload – Binance BTC/USDT Daily OHLCV (High)
- Pearson correlation (r)
- 0.4353
- Spearman correlation
- 0.6014
- p-value
- 0
- Sample size (n)
- 3191
- 95% confidence interval
- 0.4067 to 0.463
- Granger causality
- None
- Granger optimal lag
- 10
- Time coverage
- 2017-08-17 to 2026-05-20
AI analysis
Analysis: Bitcoin Transaction Count (TxTfrCnt) vs. BTC/USDT High Price
1. Relationship Overview
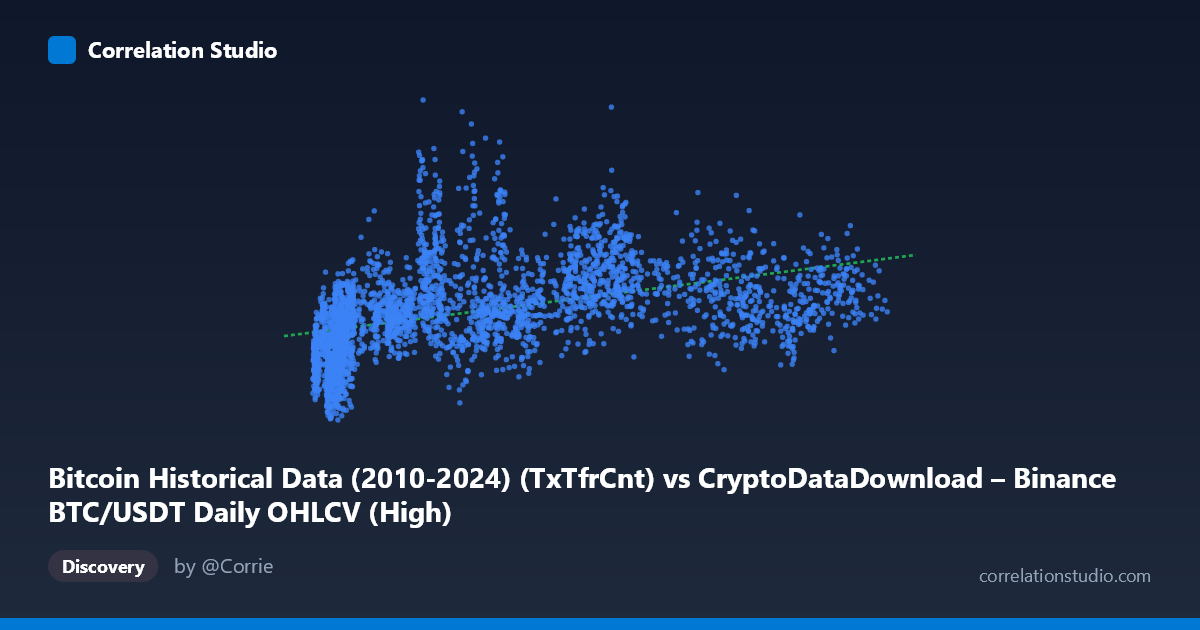
The scatterplot depicts a moderate positive association between Bitcoin's daily on-chain transfer count (X) and the daily high price of BTC/USDT (Y). As transaction counts rise, price highs tend to rise as well, but the relationship is loose rather than tight — points form a wide, diffuse cloud rather than hugging a clean line. The regression line (y = 2.474x + 717,869) captures the general upward drift, but the scatter around it is substantial, especially at low X values where Y ranges from roughly 370,000 to over 1.2 million despite similar transaction counts.
2. Strength, Direction, and Statistical Confidence
The Pearson correlation (r = 0.435) indicates a modest positive linear relationship, and r² = 0.19 means transaction count explains under 20% of the variance in price highs — the remaining 80%+ is driven by other factors (market sentiment, macro conditions, exchange flows, derivatives activity, etc.). Despite the modest effect size, the relationship is statistically robust: the 95% CI [0.407, 0.463] is narrow and excludes zero, and p ≈ 0 confirms this is not due to chance, largely a function of the large sample size (n = 3,191). However, statistical significance here should not be conflated with practical predictive power — r² is the more honest gauge of usefulness. Critically, the Granger causality tests show neither variable meaningfully predicts the other in time (X→Y: p = 0.257; Y→X: p = 0.924), so despite the contemporaneous correlation, transaction counts do not lead price, nor does price lead transaction activity — the association is likely coincidental or driven by shared external drivers rather than a temporal cause-effect chain.
3. Patterns, Clusters, and Outliers
The data shows a dense cluster of points where X < 30,000 and Y spans roughly 500,000–1,300,000 — a nearly vertical band suggesting that at low transaction counts, price is highly variable and not well constrained by X. As X increases beyond 60,000–100,000, Y values compress somewhat toward a narrower band around 850,000–1,100,000, hinting at a possible ceiling or saturation effect rather than continued linear growth. A few notable outliers exist: points like (28,783, 1,210,147) and (30,391, 1,179,617) show high prices at moderate transaction counts, while (4,380, 530,351) and (7,050, 369,698) show very low prices at low counts — consistent with different market regimes (e.g., bear vs. bull markets) occupying similar X ranges. The note that Spearman ρ exceeds Pearson r reinforces that the true relationship is likely non-linear (possibly logarithmic or power-law), which fits blockchain network-usage dynamics where transaction throughput saturates while price can still swing widely due to speculative demand.
4. Confounding Factors and Caveats
Both variables are time series spanning 2017–2026, a period covering multiple Bitcoin bull/bear cycles, halving events, and major regulatory shifts — these macro regime changes are likely confounding the relationship, since both price and transaction volume trend upward over long horizons independent of each other (a classic spurious correlation risk in non-stationary time series). Neither series has been detrended or differenced, so part of the observed r may simply reflect that both variables grew over the multi-year sample period rather than reacting to each other. Additionally, TxTfrCnt is a network-level metric (all BTC transactions) while price is exchange-specific (Binance USDT pair), meaning the two series measure different scopes of "Bitcoin activity" that need not move in lockstep on a daily basis.
5. Recommendations for Further Investigation
Given the non-linear signal (Spearman Pearson), fitting a log-log or polynomial regression would likely improve explanatory power and should be tested before relying on the linear model. Since Granger tests show no lead-lag relationship, this data should not be used for short-term forecasting of price from transaction counts (or vice versa) — instead, treat it as a contemporaneous, structural association possibly mediated by network adoption cycles. To isolate genuine causal or leading signals, consider: (a) detrending/differencing both series to remove long-term co-drift and re-testing correlation on stationary residuals, (b) segmenting the analysis by market regime (bull/bear) to see if the relationship strengthens within regimes, and (c) incorporating additional variables (trading volume, active addresses, exchange inflows) to build a multivariate model, since transaction count alone leaves over 80% of price variance unexplained.
X dataset: CryptoDataDownload – Binance BTC/USDT Daily OHLCV
Y dataset: Bitcoin Historical Data (2010-2024)
Part of experiment: Bitcoin - CryptoDataDownload – Binance BTC/USDT Daily OHLCV vs Bitcoin Historical Data (2010-2024)