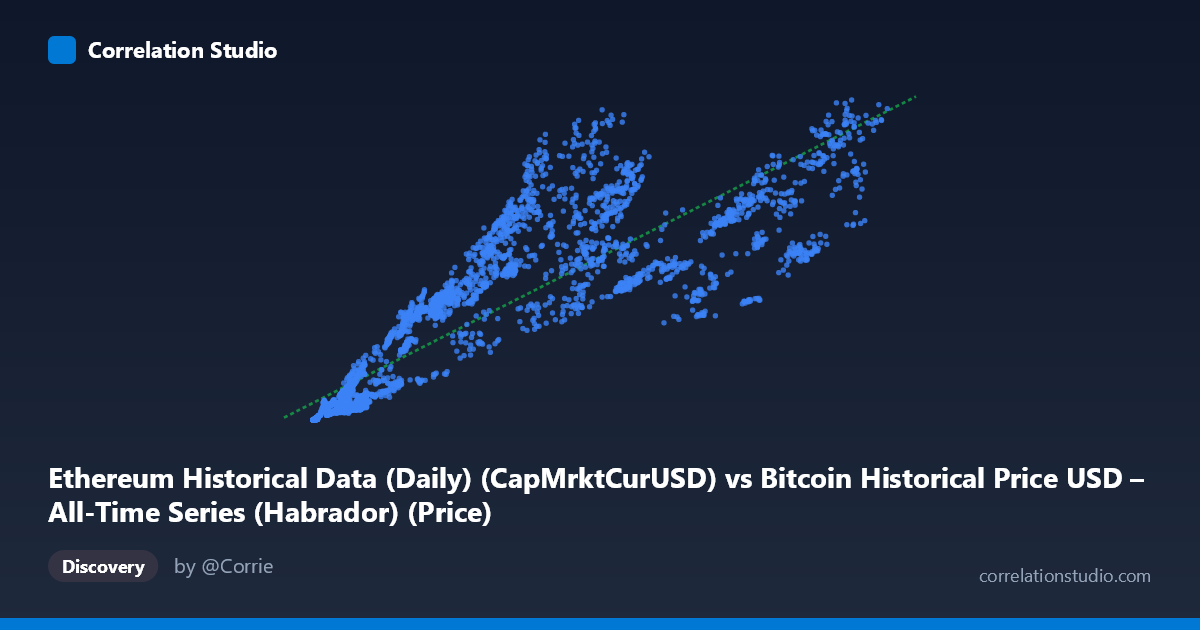
Ethereum Historical Data (Daily) (CapMrktCurUSD) vs Bitcoin Historical Price USD – All-Time Series (Habrador) (Price)
- Pearson correlation (r)
- 0.8791
- Spearman correlation
- 0.9482
- p-value
- 0
- Sample size (n)
- 3942
- 95% confidence interval
- 0.8718 to 0.886
- Granger causality
- None
- Granger optimal lag
- 10
- Time coverage
- 2015-08-08 to 2026-05-23
- Recomputed on refreshed data
- 2026-10-24 (r was 0.88)
AI analysis
Analysis: Ethereum Market Cap vs. Bitcoin Price Relationship
1. What the Visualization Reveals
The scatterplot depicts a strong positive relationship between Ethereum's market capitalization (X-axis) and Bitcoin's price (Y-axis) across nearly 3,917 daily observations spanning 2015–2026. As Ethereum's market cap rises from small values (hundreds to low thousands) to over $124,000M, Bitcoin's price climbs correspondingly from tens of millions to over $584 billion in the sampled units. The data points trace a generally upward-sloping band, consistent with the fitted linear regression (y = 4.31M·x + 29.8B), suggesting the two assets have moved together throughout most of their shared market history.
2. Strength, Direction, and Statistical Confidence
The correlation coefficient (r = 0.88) indicates a strong positive linear relationship, with r² = 0.774 meaning roughly 77% of the variance in Bitcoin's price can be statistically explained by Ethereum's market cap. The narrow 95% confidence interval [0.873, 0.887] and p-value of essentially 0 confirm this correlation is highly statistically reliable and not a product of sampling noise — with nearly 4,000 data points, even modest relationships would reach significance, but an r this high reflects a genuinely robust co-movement.
However, the Granger causality results temper any causal interpretation: neither variable significantly predicts the other's future values at the optimal lag (10 periods), with both F-tests yielding high p-values (0.67 and 0.84). This is a critical distinction — strong contemporaneous correlation without temporal predictive power suggests both assets are likely responding to shared external drivers (e.g., overall crypto market sentiment, macroeconomic conditions, regulatory news) rather than one directly influencing the other in a lead-lag fashion.
3. Notable Patterns and Non-Linear Features
Examining the sampled points, the relationship appears reasonably linear in the lower-to-mid range but shows signs of heteroscedasticity — variance in Y appears to increase substantially as X grows (e.g., at X≈45,000, Y ranges widely from ~167B to ~387B). This fanning pattern suggests the linear model may underfit at higher market cap levels, and a log-log or power-law relationship might fit better, which is common in financial asset pricing data spanning multiple orders of magnitude. There also appear to be several regime-like clusters (e.g., a cluster of points with X between 8,000–20,000 showing Y values clustering both low ~20-70B and higher ~140B), potentially reflecting distinct market cycles (bull/bear phases) rather than one continuous relationship.
4. Confounding Factors and Caveats
The most significant caveat is that both variables are prices/market caps of major cryptocurrencies during overlapping time periods — this is a classic case of spurious correlation risk driven by shared temporal trends. Both BTC and ETH have experienced simultaneous multi-year bull and bear cycles driven by common macro factors (interest rates, institutional adoption, regulatory shifts, overall crypto market liquidity), not necessarily because one drives the other. Time-series data of this nature often exhibits high correlation simply due to non-stationarity (both trending upward over time) rather than genuine structural linkage. The Granger test results reinforce this — the lack of predictive causality suggests the correlation may be an artifact of common trends rather than a functional economic relationship.
5. Actionable Insights and Further Investigation
Given the non-stationarity concern, analysts should test correlation on differenced or log-returns data rather than raw price levels, which would better isolate whether short-term co-movements exist beyond shared long-term trends. Additionally, testing for cointegration (e.g., Engle-Granger or Johansen tests) would clarify whether a long-run equilibrium relationship exists despite the lack of Granger causality. Given the apparent heteroscedasticity, refitting with a log-log model could improve explanatory power and better reflect the multiplicative nature of crypto asset growth. Finally, incorporating a third variable (e.g., total crypto market cap, BTC dominance, or macro liquidity indices) as a control could help determine whether this ETH-BTC relationship is direct or mediated by broader market forces.
X dataset: Bitcoin Historical Price USD – All-Time Series (Habrador)
Y dataset: Ethereum Historical Data (Daily)
Part of experiment: Bitcoin - Bitcoin Historical Price USD – All-Time Series (Habrador) vs Ethereum Historical Data (Daily)