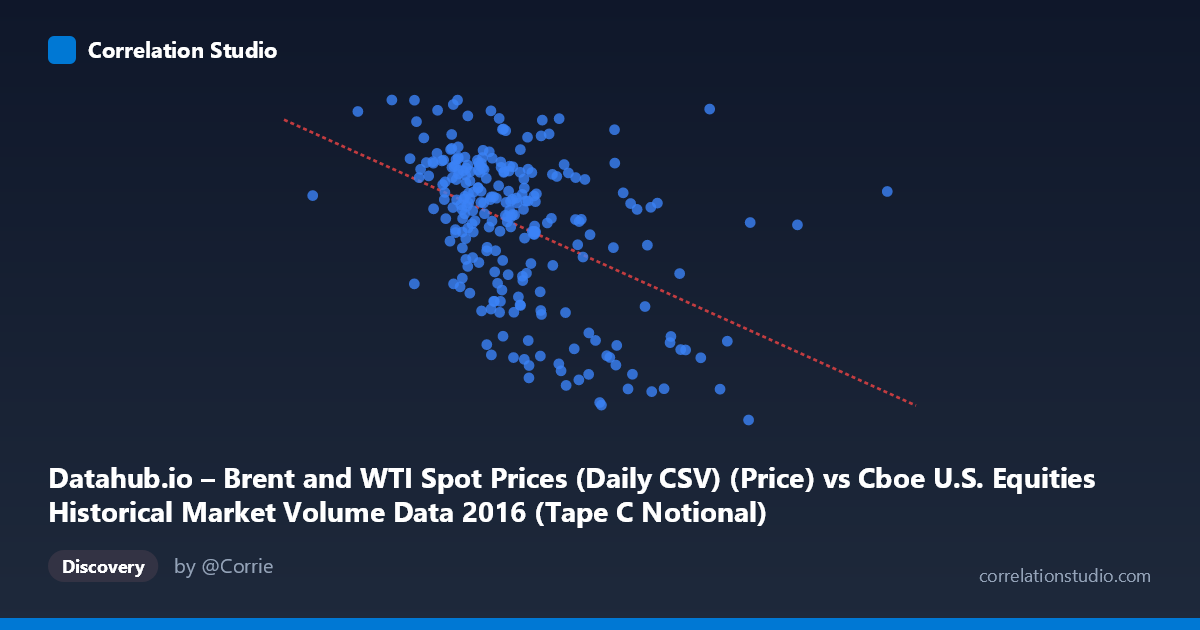
Datahub.io – Brent and WTI Spot Prices (Daily CSV) (Price) vs Cboe U.S. Equities Historical Market Volume Data 2016 (Tape C Notional)
- Pearson correlation (r)
- -0.46
- Spearman correlation
- -0.466
- p-value
- 0
- Sample size (n)
- 251
- 95% confidence interval
- -0.5524 to -0.3565
- Granger causality
- None
- Granger optimal lag
- 1
AI analysis
Scatterplot Analysis: Oil Prices vs. U.S. Equity Market Notional Volume (2016)
Relationship Overview The scatterplot reveals a negative relationship between Brent/WTI crude oil spot prices (X-axis) and Cboe Tape C notional trading volume (Y-axis) across U.S. equity markets in 2016. As oil prices increase, notional trading volume in U.S. equities tends to decline. The linear regression equation (y = -2.70×10⁻⁹x + 57.14) confirms this inverse slope, though the scatter around the regression line is visually substantial, suggesting the relationship is real but far from deterministic. The data spans the full 2016 trading year, capturing a period when oil prices recovered from multi-year lows, providing meaningful variation across both dimensions.
Correlation Strength and Statistical Significance The Pearson correlation of r = -0.46 indicates a moderate negative association, but the variance explained metric provides important grounding: r² = 0.2116 means only ~21% of the variance in notional trading volume is explained by oil price movements, leaving roughly 79% attributable to other factors. The 95% confidence interval of [-0.55, -0.36] is meaningfully narrow and does not cross zero, and the p-value of 1.51×10⁻¹⁴ confirms the correlation is highly statistically significant given the sample of 251 paired observations drawn from a population of 3,622. However, statistical significance here is partly a function of sample size rather than effect magnitude. Critically, the Granger causality tests reveal no significant temporal predictive relationship in either direction (X→Y: F=0.21, p=0.65; Y→X: F=0.21, p=0.64), meaning that past oil prices do not reliably predict future trading volume, nor vice versa. This fundamentally limits causal interpretation — the correlation reflects co-movement, not a predictive mechanism.
Notable Patterns, Clusters, and Outliers Several structural features stand out. There is a dense cluster of observations between approximately $40–$52/barrel and 44–52 notional volume units, suggesting that mid-range oil prices corresponded with relatively stable, moderately high trading activity for much of 2016. However, at the lower end of oil prices (roughly $27–$35/barrel), notional volume is highly variable — some points show very low volume while others cluster near the mid-range, producing a "fan-like" dispersion at lower price levels. Several notable outliers are visible: the point near (8.5B, 26) represents a day of very high equity market notional volume paired with very low oil prices, while points in the upper-right region (~$49–$54, lower X values) suggest that lower equity volume coincided with higher oil prices. The non-linear possibility is worth noting — the relationship may be stronger at extreme oil price values and weaker in the mid-range.
Confounding Factors and Caveats The most significant caveat is the dataset labeling ambiguity: the X-axis column is labeled as originating from a Cboe market volume dataset yet describes oil prices, and the Y-axis originates from oil price data yet describes notional equity volume — suggesting a possible metadata or axis-labeling swap that should be verified before drawing firm conclusions. Substantively, 2016 was an unusual year characterized by oil price recovery from historic lows, Brexit volatility (June), and U.S. election uncertainty (November), all of which independently drove equity volume spikes. These macroeconomic shocks could simultaneously depress oil prices and elevate trading volume, creating a spurious or partially confounded negative correlation. Additionally, Tape C specifically covers NYSE Arca-listed securities (often including energy ETFs), which may have an amplified sensitivity to oil price movements compared to broader market indices, potentially overstating the generalizability of this relationship.
Actionable Insights and Further Investigation Despite the moderate correlation and absence of Granger causality, this relationship warrants further investigation in several directions. First, segmenting the data by market regime — pre- and post-OPEC announcements, Brexit, and the U.S. election — would clarify whether the correlation is driven by discrete event clusters rather than a persistent structural relationship. Second, testing non-linear models (e.g., quadratic or piecewise regression) may better capture the apparent heteroscedasticity at lower oil price levels. Third, extending the analysis beyond 2016 to multiple years would test whether this correlation is a 2016-specific phenomenon or a durable feature of equity-oil price dynamics. Finally, incorporating implied volatility (VIX) as a control variable would help isolate whether the oil-volume relationship is mediated by broad market fear rather than oil prices per se, which would be a more actionable finding for trading strategy or risk management purposes.
X dataset: Cboe U.S. Equities Historical Market Volume Data 2016
Y dataset: Datahub.io – Brent and WTI Spot Prices (Daily CSV)
Part of experiment: Daily - Cboe U.S. Equities Historical Market Volume Data 2016 vs Datahub.io – Brent and WTI Spot Prices (Daily CSV)