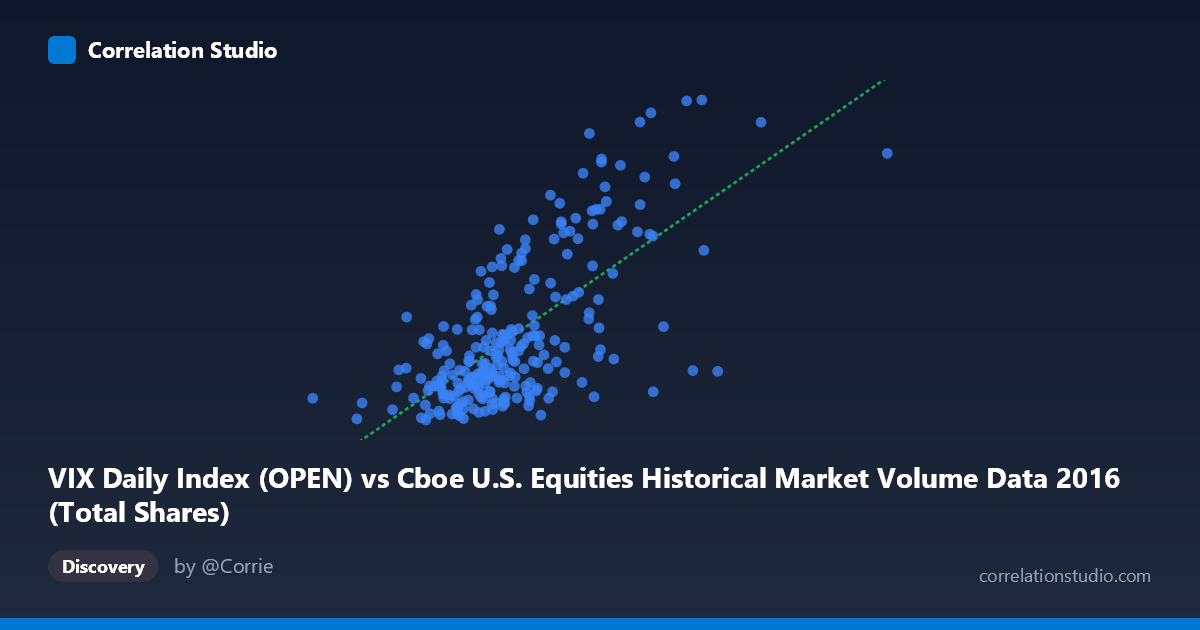
VIX Daily Index (OPEN) vs Cboe U.S. Equities Historical Market Volume Data 2016 (Total Shares)
- Pearson correlation (r)
- 0.6764
- Spearman correlation
- 0.6073
- p-value
- 0
- Sample size (n)
- 252
- 95% confidence interval
- 0.6032 to 0.7382
- Granger causality
- None
- Granger optimal lag
- 1
AI analysis
Scatterplot Analysis: VIX Open vs. Total Shares Volume (2016)
Relationship Overview
The scatterplot reveals a positive relationship between the Cboe VIX Daily Index (Open) on the X-axis and Total Shares traded on the Y-axis across U.S. equities markets throughout 2016. As VIX open values increase — indicating rising market fear or uncertainty — total share volume also tends to rise, which aligns with well-established market intuition: periods of elevated volatility characteristically draw heavier trading activity as investors reposition, hedge, or react to market stress. The linear regression equation (y = 2.456E-08x + 3.424) confirms a positive slope, though the intercept and scale reflect the large numerical magnitude of the share volume figures.
Correlation Strength and Statistical Framing
The correlation coefficient of r = 0.6764 indicates a moderately strong positive association, and the R² of 0.4574 means that roughly 45.7% of the variance in total share volume is explained by VIX open levels — a meaningful but incomplete picture, leaving over half the variance attributable to other factors. The 95% confidence interval of [0.6032, 0.7382] is relatively tight and does not approach zero, and the p-value of effectively 0 (against N = 3,622) confirms this relationship is statistically robust and almost certainly not a sampling artifact. However, the Granger causality results are notably absent: neither direction (X→Y: F = 0.121, p = 0.728; Y→X: F = 0.400, p = 0.528) reaches significance at even a relaxed threshold. This means that while VIX and volume move together, neither variable reliably predicts the other at a one-period lag — they appear to respond to common underlying forces simultaneously rather than one leading the other in a temporal sequence.
Notable Patterns, Clusters, and Outliers
The sample points reveal a dense central cluster concentrated in the VIX range of approximately 400M–550M (X-axis) and VIX values of 12–17 (Y-axis), reflecting calm, low-volatility baseline trading conditions that dominated much of 2016. Several prominent outliers are visible in the upper-right region — most notably points near (708M, 27.79) and (583M, 23.30) — which likely correspond to specific market stress events during the year, such as the Brexit referendum in late June or pre/post-election volatility in November. These high-leverage outliers are disproportionately influencing the regression slope and may be inflating the overall r value. The relationship also shows signs of heteroscedasticity: variance in Y appears to fan out as X increases, suggesting the relationship is less predictable at elevated VIX levels than during calm periods.
Confounding Factors and Caveats
Several important caveats apply to this interpretation. First, note the axis labeling: the dataset descriptions appear to be swapped — VIX data is listed as the X-axis source while the volume column is attributed to the VIX dataset, suggesting a potential metadata or labeling inconsistency that warrants verification before drawing firm conclusions. Second, the relationship is likely driven heavily by shared macro event exposure — major market events (elections, central bank decisions, geopolitical shocks) simultaneously spike VIX and volume without one causing the other. Third, the daily resolution may mask intraday dynamics where causality is more complex. Finally, 2016 was a structurally unusual year with the Brexit vote and U.S. presidential election, meaning findings may not generalize well to other time periods.
Actionable Insights and Further Investigation
Practitioners could use VIX open levels as a rough signal for expected volume regimes, which has practical applications in trade execution scheduling, liquidity provision, and risk management — elevated VIX days should prompt anticipation of higher volume and wider spreads. However, given the absence of Granger causality, VIX should not be used as a predictive input for next-period volume in quantitative models without additional feature engineering. Further investigation should include: (1) event-flagging the clear outlier days to assess whether the relationship holds outside stress episodes; (2) testing non-linear models (e.g., quadratic or threshold regression) given the apparent heteroscedasticity; (3) extending the analysis across multiple years to test temporal stability; and (4) incorporating additional variables such as S&P 500 returns, options expiration calendars, or macroeconomic releases to better account for the unexplained 54% of variance.
X dataset: Cboe U.S. Equities Historical Market Volume Data 2016
Y dataset: VIX Daily Index
Part of experiment: Daily - Cboe U.S. Equities Historical Market Volume Data 2016 vs VIX Daily Index