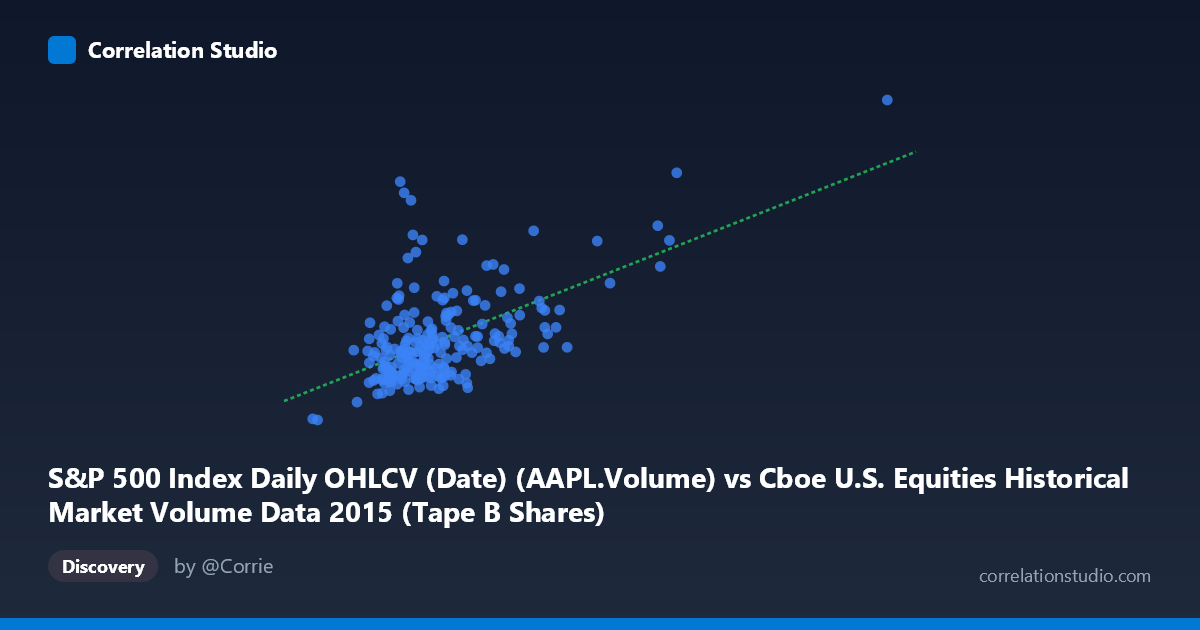
S&P 500 Index Daily OHLCV (Date) (AAPL.Volume) vs Cboe U.S. Equities Historical Market Volume Data 2015 (Tape B Shares)
- Pearson correlation (r)
- 0.5698
- Spearman correlation
- 0.4251
- p-value
- 0
- Sample size (n)
- 222
- 95% confidence interval
- 0.4737 to 0.6525
- Granger causality
- None
- Granger optimal lag
- 10
AI analysis
Scatterplot Analysis: AAPL Volume vs. Cboe Tape B Shares (2015)
Relationship Overview The scatterplot reveals a moderate positive relationship between Apple Inc.'s daily trading volume (X-axis, drawn from S&P 500 OHLCV data) and Cboe U.S. Equities Tape B share volume (Y-axis). As AAPL trading volume increases, Tape B market volume tends to rise correspondingly, which is intuitively consistent — AAPL is one of the most heavily traded securities in U.S. markets, and elevated activity in a bellwether stock like AAPL often coincides with broader market participation. The linear regression equation y = 0.3948x + 9,659,560 suggests that for every additional share of AAPL traded, Tape B volume increases by roughly 0.39 shares, with a substantial baseline intercept reflecting the persistent background volume independent of AAPL activity.
Correlation Strength and Statistical Significance The Pearson correlation of r = 0.5698 indicates a moderate positive association, but the coefficient of determination r² = 0.3247 is the more sobering figure — only 32.5% of the variance in Tape B volume is explained by AAPL volume. The remaining ~67.5% is driven by other factors entirely. The 95% confidence interval [0.4737, 0.6525] is reasonably tight and does not approach zero, and the p-value of effectively 0 (given n = 222) confirms this correlation is highly unlikely to be a statistical artifact. That said, statistical significance does not imply practical or causal significance. Critically, Granger causality testing finds no significant directional predictive relationship in either direction (X→Y: F = 0.862, p = 0.570; Y→X: F = 0.806, p = 0.624), meaning that past AAPL volume does not help forecast future Tape B volume, and vice versa, at the optimal 10-period lag. This substantially limits the operational utility of the correlation for forecasting purposes.
Notable Patterns, Clusters, and Outliers The bulk of the data clusters in a relatively compact region — AAPL volumes roughly between 70M–130M shares and Tape B volumes between 25M–75M shares — suggesting a stable "normal trading regime" for most of 2015. However, two points stand out as significant outliers: (311,969,106; 162,206,300) sits dramatically far from the main cluster, representing an extreme high-volume event in both series simultaneously, likely corresponding to a major market shock or earnings event. A second notable outlier around (205M, 103M) also departs from the central mass. Additionally, a handful of points show high Y values (~124M Tape B shares) at relatively moderate X values (~85M AAPL shares), suggesting occasional decoupling where broader market activity surges independently of AAPL. These outliers likely exert disproportionate leverage on the regression line and may be inflating the correlation coefficient.
Confounding Factors and Interpretive Caveats Several important caveats apply. First, both variables are market volume metrics measured over the same time period (Feb–Dec 2015), making it highly plausible that a common latent driver — overall market volatility, macroeconomic news, Federal Reserve announcements, or broad risk-on/risk-off sentiment — is simultaneously moving both series, producing a spurious or inflated correlation. Second, the axis labels appear to be swapped relative to the dataset descriptions (AAPL volume is listed as coming from the Cboe dataset and Tape B from the S&P OHLCV dataset), which warrants data pipeline verification before drawing firm conclusions. Third, the moderate r² and failed Granger tests together suggest this is likely a coincident rather than predictive relationship. Finally, with N = 506 total observations but only n = 222 paired samples used, it is worth confirming that missing data is not systematically biasing the sample toward high- or low-volume days.
Actionable Insights and Further Investigation Given the failed Granger causality results, practitioners should not use AAPL volume as a leading indicator for Tape B volume in any trading or risk model without further validation. However, the moderate contemporaneous correlation does suggest that AAPL could serve as a real-time proxy or component signal within a broader same-day volume estimation model. Recommended next steps include: (1) investigating the extreme outliers to identify specific dates and whether they correspond to identifiable market events that should be treated separately; (2) controlling for the VIX or a broad volatility index to test whether the correlation disappears once overall market stress is accounted for; (3) expanding the Granger analysis to shorter lag structures (1–5 periods) given intraday dynamics; and (4) extending the dataset beyond 2015 to test whether this correlation is stable across different market regimes or is specific to 2015's volatility environment, which included the August 2015 flash crash — a likely candidate for the extreme outlier.
X dataset: Cboe U.S. Equities Historical Market Volume Data 2015
Y dataset: S&P 500 Index Daily OHLCV (Date)
Part of experiment: Daily - Cboe U.S. Equities Historical Market Volume Data 2015 vs S&P 500 Index Daily OHLCV (Date)