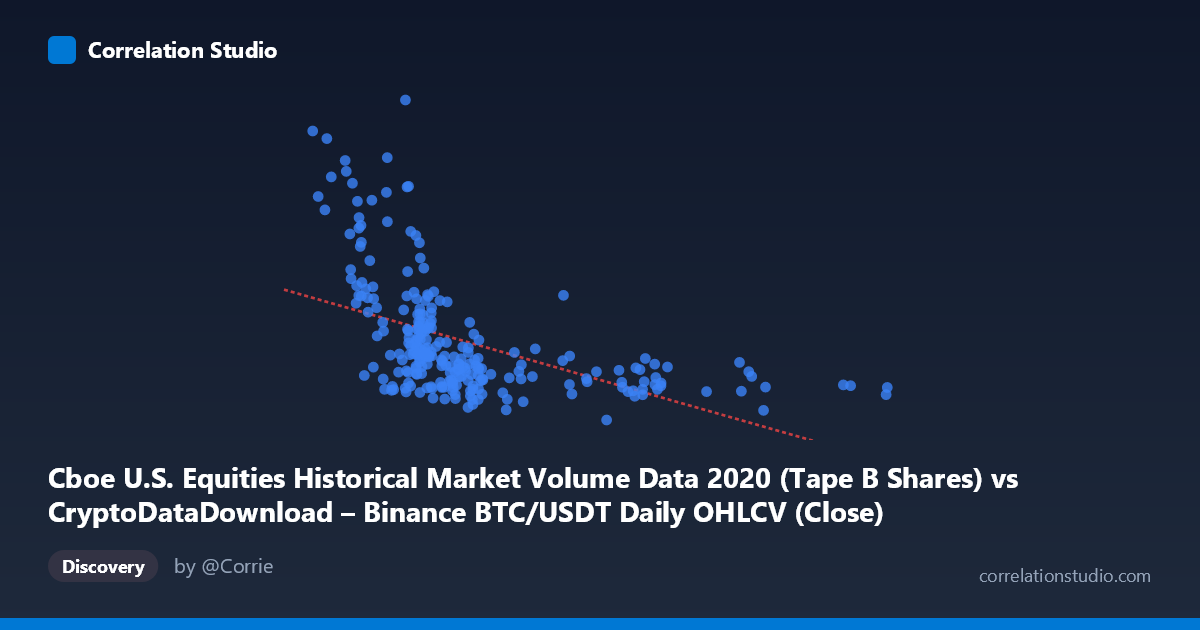
Cboe U.S. Equities Historical Market Volume Data 2020 (Tape B Shares) vs CryptoDataDownload – Binance BTC/USDT Daily OHLCV (Close)
- Pearson correlation (r)
- -0.4984
- Spearman correlation
- -0.6544
- p-value
- 0
- Sample size (n)
- 253
- 95% confidence interval
- -0.5857 to -0.3996
- Granger causality
- None
- Granger optimal lag
- 10
- Time coverage
- 2020-01-02 to 2020-12-31
AI analysis
Analysis: Cboe Equity Volume vs. Binance BTC/USDT Close Price (2020)
1. Overview of the Relationship
The scatterplot displays a moderate negative relationship between Cboe U.S. equities market volume (X-axis) and Bitcoin's closing price (Y-axis) across 253 paired daily observations in 2020. The data shows a clear downward-sloping cloud of points, but with substantial vertical dispersion at any given X value — particularly in the lower X range (7,000–12,000), where Y values span an enormous range from roughly 58 million to 341 million. This heteroscedastic scatter suggests that low equity volume days coincide with highly variable BTC prices, while higher equity volume days (18,000+) consistently correspond to lower, more tightly clustered BTC prices (70–100 million range).
2. Strength, Direction, and Statistical Confidence
The Pearson correlation of r = -0.498 indicates a moderate negative linear association, with r² = 0.248 meaning only about 25% of the variance in BTC closing price is statistically explained by equity volume — leaving 75% attributable to other factors. The 95% CI [-0.586, -0.400] is reasonably tight and excludes zero, and the p-value ≈ 0 confirms this correlation is highly unlikely to be due to chance given the sample size. However, statistical significance should not be conflated with practical predictive strength — a moderate r² means this variable alone is a weak-to-modest predictor. Critically, the Granger causality tests show no significant temporal predictive direction in either direction (X→Y: p=0.877; Y→X: p=0.147), meaning neither series reliably helps forecast the other's future values when accounting for lagged relationships. This strongly suggests the correlation is contemporaneous/coincidental (or driven by shared external factors) rather than reflecting a causal or lead-lag dynamic.
3. Notable Patterns and Outliers
Several structural features stand out: - A dense low-X cluster (X: 7,000–12,000) contains most points and the widest Y-range, including extreme outliers like (8,692.91, 341.7M) and (5,578.60, 270.9M) — these appear to be BTC price spikes (likely reflecting the March–December 2020 bull run) occurring during periods of moderate equity trading volume. - A sparser high-X cluster (X: 17,000–24,000) shows consistently low, stable Y-values (70–100M range), suggesting these correspond to a distinct period (likely COVID-related volume spikes in equities, e.g., March 2020) when BTC prices were still relatively subdued. - The relationship looks more like two regimes rather than a single continuous linear trend — early-2020 high-volatility equity markets (COVID crash) vs. later 2020 as BTC entered its price rally. This bifurcation, combined with the note that Spearman ρ exceeds Pearson r, supports a non-linear or regime-dependent relationship rather than a clean linear one.
4. Confounding Factors and Caveats
This correlation is almost certainly confounded by time/macro trends rather than reflecting a direct mechanistic link between equity volume and BTC price: - Both series are non-stationary time series from 2020, a year dominated by the COVID-19 crash (Feb–Mar) and subsequent recovery/rally — equity volume spiked during the crash while BTC price cratered then rallied later in the year. This shared temporal structure (not causation) likely drives the apparent negative correlation. - No lagged relationship (per Granger test) reinforces that this is likely a spurious or indirect correlation mediated by broader market conditions (fear/volatility indices, monetary policy, liquidity conditions) rather than one series driving the other. - Daily data aggregation masks intraday dynamics and doesn't control for autocorrelation within each series.
5. Suggestions for Further Investigation
- Detrend or difference both series (e.g., use daily returns/changes instead of levels) to remove shared time trends and retest correlation — this often reveals whether a "real" relationship exists beneath the trend. - Segment the analysis by regime (pre/post March 2020 crash) to test whether the relationship is stable or driven entirely by the crash period. - Introduce a third variable such as VIX, USD liquidity measures, or crypto-specific volume/volatility indices to test for confounding — a partial correlation controlling for time or volatility could clarify whether this link is direct or spurious. - Given the Granger results, avoid using equity volume as a predictive feature for BTC price in forecasting models; instead, treat this as a descriptive/contemporaneous association only.
X dataset: CryptoDataDownload – Binance BTC/USDT Daily OHLCV
Y dataset: Cboe U.S. Equities Historical Market Volume Data 2020
Part of experiment: Bitcoin - CryptoDataDownload – Binance BTC/USDT Daily OHLCV vs Cboe U.S. Equities Historical Market Volume Data 2020