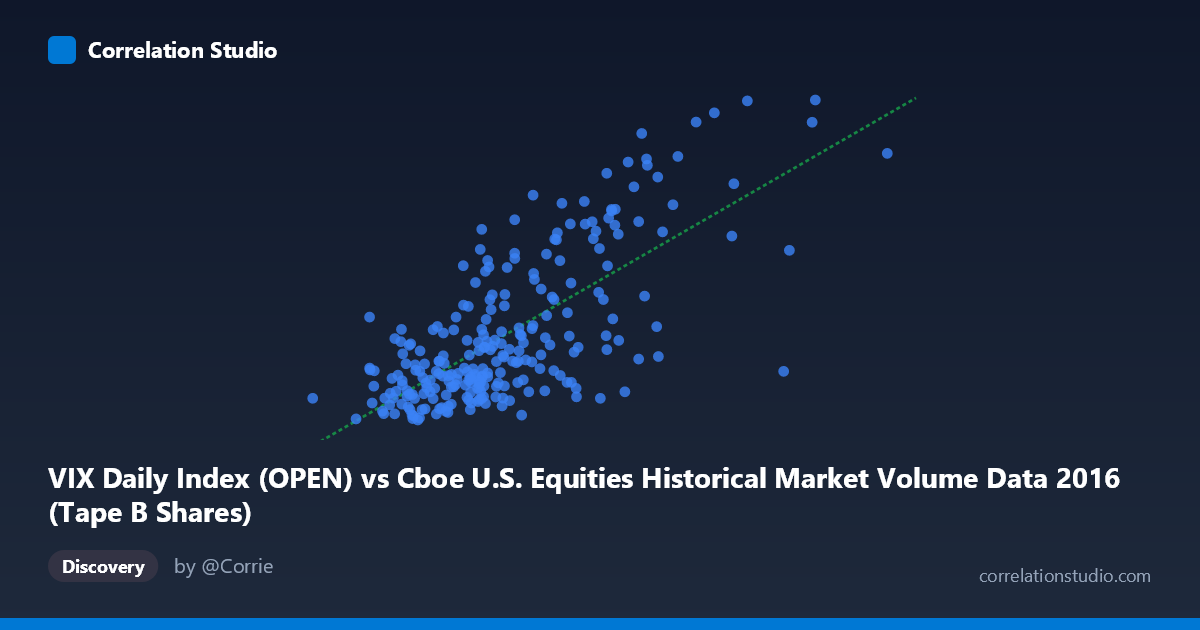
VIX Daily Index (OPEN) vs Cboe U.S. Equities Historical Market Volume Data 2016 (Tape B Shares)
- Pearson correlation (r)
- 0.7188
- Spearman correlation
- 0.6421
- p-value
- 0
- Sample size (n)
- 252
- 95% confidence interval
- 0.6533 to 0.7737
- Granger causality
- None
- Granger optimal lag
- 1
AI analysis
Scatterplot Analysis: VIX Daily Index (Open) vs. Tape B Shares (2016)
Overall Relationship
The scatterplot reveals a clear positive relationship between the VIX Daily Index opening values and Cboe U.S. Equities Tape B share volume in 2016. As VIX levels rise — reflecting higher expected market volatility — Tape B share volume tends to increase correspondingly. This is intuitively consistent with well-established market microstructure dynamics: periods of elevated volatility typically drive heightened trading activity as investors reposition portfolios, hedge exposures, or respond to market uncertainty. The linear regression equation (y = 9.625×10⁻⁸x + 5.699) confirms this positive slope, though the intercept suggests a meaningful baseline volume level even during calm markets.
Correlation Strength and Statistical Significance
The correlation coefficient of r = 0.719 indicates a moderately strong positive association, and with r² = 0.517, approximately 51.7% of the variance in Tape B share volume is explained by VIX open levels — a practically substantial but far from complete explanation. The 95% confidence interval of [0.653, 0.774] is reassuringly narrow, reflecting the reasonably large paired sample (n = 252 trading days), and the p-value of effectively zero confirms that this relationship is statistically robust and extremely unlikely to be a chance artifact. However, the Granger causality results tell a more nuanced story: neither direction (X→Y: F = 0.005, p = 0.943; Y→X: F = 0.197, p = 0.657) achieves significance, meaning that despite the strong contemporaneous correlation, neither variable reliably predicts the other on a lead-lag basis at a 1-period lag. This suggests the two variables tend to move together simultaneously rather than one driving the other with a measurable temporal delay.
Notable Patterns and Outliers
The sample points reveal meaningful heterogeneity across the distribution. The bulk of observations cluster in the lower-left region, with VIX values roughly between 75M–115M and Tape B shares between 11–17, consistent with the relatively calm equity environment that characterized much of 2016. However, several prominent high-leverage outliers are visible in the upper-right quadrant — most notably the point near (170.6M, 27.79), which likely corresponds to a specific volatility spike event (possibly around the Brexit vote in late June 2016 or the U.S. presidential election in November). Additional elevated observations around (126M, 23.30), (133M, 22.15), and (142M, 22.88) reinforce this cluster of stress episodes. These outliers exert disproportionate influence on the regression slope and correlation coefficient and merit individual investigation.
Confounding Factors and Caveats
Several important caveats apply to this analysis. First, reverse causality is plausible: high trading volume in fragmented markets (Tape B specifically covers NYSE American and regional exchanges) could itself amplify price uncertainty and contribute to VIX movements, yet the Granger results preclude a clean directional interpretation. Second, omitted variables such as macroeconomic announcements, Federal Reserve policy communications, or geopolitical events likely drive both variables simultaneously, inflating the observed correlation without implying a direct causal mechanism. Third, Tape B is a subset of total U.S. equity volume; using aggregate volume might yield different results. Finally, the dataset covers only a single calendar year (2016), a period with distinct volatility episodes, making generalization to other market regimes uncertain.
Actionable Insights and Further Investigation
Practitioners in market structure, trading operations, or risk management could use this relationship as a real-time volume anticipation signal: elevated VIX openings provide a forward indicator of elevated Tape B activity on the same day, useful for staffing, liquidity provision, and transaction cost modeling. However, given the absence of Granger causality, this should not be used as a lagged trading signal. Further investigation should explore: (1) non-linear modeling (e.g., piecewise regression or quantile regression) to better capture the accelerating relationship at high VIX levels; (2) event-study analysis isolating the specific high-outlier dates to confirm whether discrete macro events are driving the upper tail; (3) multi-year replication across different volatility regimes (e.g., 2020) to test stability of the r² ≈ 0.52 finding; and (4) extending the analysis to Tape A and Tape C volumes to assess whether the VIX–volume relationship is uniform across exchange segments.
X dataset: Cboe U.S. Equities Historical Market Volume Data 2016
Y dataset: VIX Daily Index
Part of experiment: Daily - Cboe U.S. Equities Historical Market Volume Data 2016 vs VIX Daily Index