Cboe U.S. Equities Historical Market Volume Data 2022 (Tape A Notional) vs Bitcoin Historical Price USD – All-Time Series (Habrador) (Price)
- Pearson correlation (r)
- 0.5893
- Spearman correlation
- 0.6469
- p-value
- 0
- Sample size (n)
- 251
- 95% confidence interval
- 0.5021 to 0.6646
- Granger causality
- None
- Granger optimal lag
- 10
AI analysis
Analysis: Cboe Equities Volume vs. Bitcoin Price (2022)
1. Overview of the Relationship
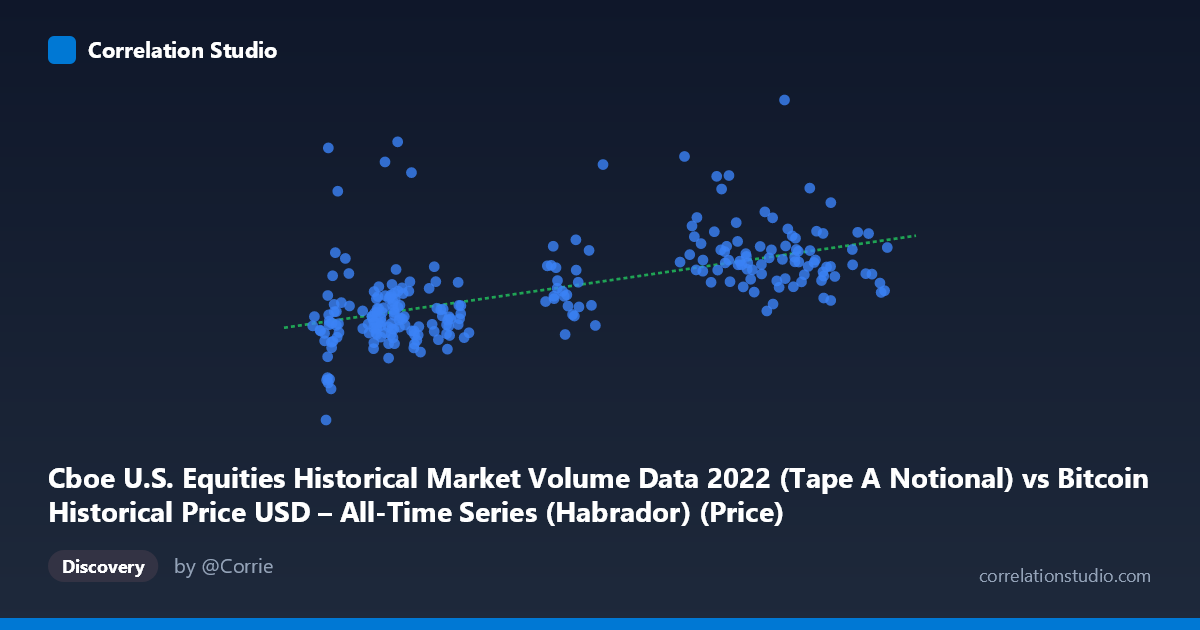
The scatterplot shows a moderate positive association between Cboe U.S. equities notional volume (X) and Bitcoin's USD price (Y) across 251 paired daily observations in 2022. While there is a discernible upward trend — higher equity volumes tend to coincide with higher Bitcoin prices — the relationship is noisy, with substantial vertical scatter at nearly every X value. This suggests the two series share some common movement but are far from tightly coupled.
2. Strength, Direction, and Statistical Confidence
The correlation coefficient (r = 0.589) indicates a moderate positive linear relationship, and r² = 0.347 tells us that only about 35% of the variance in Bitcoin's price is statistically associated with variance in equity trading volume — leaving nearly two-thirds unexplained by this single variable. The 95% confidence interval [0.502, 0.665] is reasonably tight and excludes zero, and the p-value of ~0 confirms this correlation is highly unlikely to be due to chance in this sample. However, statistical significance should not be conflated with practical strength or causal linkage: an r² of 0.35 is a modest explanatory power, not a strong predictive relationship. Critically, the Granger causality tests show no significant predictive direction in either direction (X→Y: p=0.818; Y→X: p=0.975) even at an optimal lag of 10 periods. This strongly suggests the correlation is contemporaneous/coincidental rather than reflecting genuine lead-lag forecasting power — neither series helps predict the other's future values based on past behavior.
3. Patterns, Clusters, and Outliers
Several notable features emerge in the data: - Low-X cluster with high dispersion: Around X ≈ 17,000–23,000, Y values range enormously (from ~7.4B to ~17.9B), including some striking outliers like (20471.48, 17.9B) and (21231.66, 16.3B) that sit far above the general trend for that X range. - Mid-to-high X cluster (X ≈ 37,000–46,000): Shows more consistent Y values clustering between 10.8B–14.3B, with one notable outlier at (41801.16, 20.09B) — the maximum Y value in the dataset, sitting well above the regression line. - Non-linear suggestion: The relationship may not be purely linear; there could be a plateau or saturation effect at higher X values, with the scatter narrowing somewhat compared to the wide spread at lower X values (heteroscedasticity).
4. Confounding Factors and Caveats
Several caveats are essential for proper interpretation: - Spurious correlation risk: Both series may be driven by a common underlying factor — such as macroeconomic conditions (Fed rate hikes, inflation data, risk-on/risk-off sentiment in 2022) — rather than any direct mechanical relationship between equities volume and Bitcoin price. - Time-series autocorrelation: Both X and Y likely exhibit trends/autocorrelation over 2022 (a well-documented bear market for both equities and crypto), which can artificially inflate correlation estimates in non-stationary series. - Sampling mismatch: n=251 paired samples versus a stated population of 4,769 raises questions about how the matching/alignment between datasets was performed — potential date misalignment or aggregation methods could introduce noise. - The label mismatch in the axis descriptions (X column described as Bitcoin price history, Y column described as Cboe volume, contradicting the written axis titles) suggests possible metadata confusion that should be verified before drawing strong conclusions.
5. Suggestions for Further Investigation
Given the lack of Granger causality, this correlation should not be used for predictive trading signals in either direction. To better understand the relationship, analysts should: (1) test for stationarity (e.g., ADF test) and consider differencing both series before re-running correlation/causality tests, since non-stationary trending series often produce misleading correlations; (2) investigate common macro drivers (interest rates, VIX, dollar index) as potential confounders using multivariate regression; (3) examine the identified outliers (e.g., the 20.09B and 17.9B Y-values) for specific date-driven events (FOMC announcements, crypto-specific news) that may be distorting the fit; and (4) consider a rolling correlation analysis to check whether the relationship strengthens or weakens during specific 2022 sub-periods (e.g., pre/post-FTX collapse in November 2022).
X dataset: Bitcoin Historical Price USD – All-Time Series (Habrador)
Y dataset: Cboe U.S. Equities Historical Market Volume Data 2022
Part of experiment: Bitcoin - Bitcoin Historical Price USD – All-Time Series (Habrador) vs Cboe U.S. Equities Historical Market Volume Data 2022