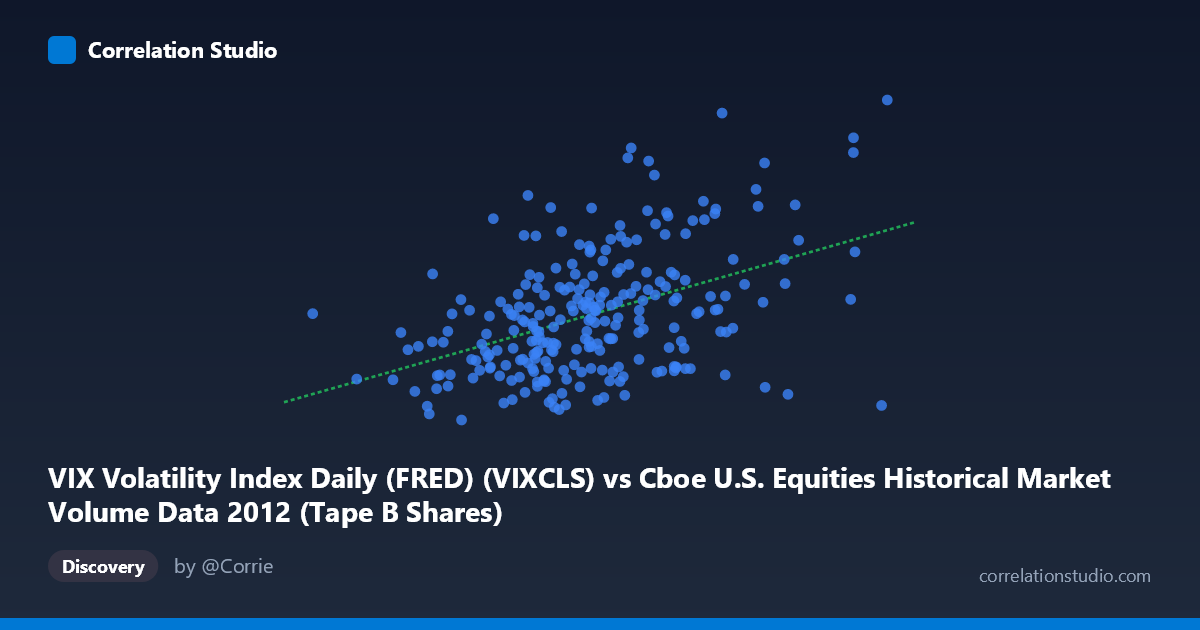
VIX Volatility Index Daily (FRED) (VIXCLS) vs Cboe U.S. Equities Historical Market Volume Data 2012 (Tape B Shares)
- Pearson correlation (r)
- 0.4476
- Spearman correlation
- 0.4153
- p-value
- 0
- Sample size (n)
- 250
- 95% confidence interval
- 0.3425 to 0.5416
- Granger causality
- None
- Granger optimal lag
- 1
AI analysis
Analysis: VIX Volatility Index vs. Cboe Tape B Share Volume (2012)
Relationship Overview The scatterplot reveals a moderate positive relationship between Cboe U.S. Equities market volume (Tape B Shares, on the X-axis) and the VIX Volatility Index (Y-axis) across 250 trading-day observations in 2012. The linear regression equation (y = 7.56×10⁻⁸x + 12.49) indicates that as daily market volume increases, VIX tends to rise modestly. This is intuitively consistent with market microstructure theory: elevated volatility typically coincides with heightened trading activity, as uncertainty drives investors to reposition, hedge, or exit positions more actively. The visualization likely shows a loosely upward-trending cloud of points with considerable scatter, suggesting the relationship exists but is far from deterministic.
Correlation Strength and Statistical Significance The Pearson correlation of r = 0.4476 reflects a moderate positive association, but the more important metric is r² = 0.2003 — meaning only about 20% of the variance in VIX is explained by Tape B share volume. The remaining 80% of VIX variation is driven by factors entirely outside this model. The 95% confidence interval of [0.3425, 0.5416] is reasonably narrow given n = 250, indicating the estimate is stable, and the p-value of 1.02×10⁻¹³ confirms the relationship is highly statistically significant — almost certainly not due to chance across the broader N = 3,750 population. However, statistical significance here is partly a function of large sample size and should not be conflated with practical or predictive significance. Critically, Granger causality testing finds no significant directional relationship in either direction (X→Y: F = 1.38, p = 0.24; Y→X: F = 0.24, p = 0.63), meaning that past volume does not help predict future VIX, nor does past VIX help predict future volume — the co-movement appears contemporaneous rather than predictive.
Patterns, Clusters, and Outliers Several notable structural features are likely visible in the chart. There appears to be a central dense cluster around X ≈ 60–80 million shares and Y ≈ 15–20 VIX, consistent with "normal" 2012 market conditions (a relatively calm post-crisis year). Points in the sample such as (75,886,770; 24.27), (80,033,969; 23.56), and (79,136,419; 24.14) represent high-volume, high-volatility events that anchor the upper-right trend. Conversely, observations like (100,834,877; 14.51) and (91,061,024; 15.31) are notable outliers — very high volume but surprisingly low VIX — suggesting days of heavy, orderly institutional trading without stress. These counter-examples weaken the linear story and hint at potential non-linearity or regime-dependent behavior: the relationship between volume and volatility may be stronger during stress episodes than during calm, high-liquidity periods.
Confounding Factors and Caveats Several important caveats apply. First, 2012 is a single calendar year with a specific macroeconomic backdrop (post-European debt crisis stabilization, QE3 announcement in September), so the correlation may not generalize to other periods. Second, Tape B shares represent only one segment of U.S. equity market volume (NYSE Arca-listed securities), while VIX reflects S&P 500 index option implied volatility — these are not perfectly matched instruments, introducing measurement mismatch. Third, both series are likely subject to common external drivers (e.g., macro news, FOMC announcements, earnings seasons) that create spurious correlation — volume and VIX may spike together not because one causes the other, but because the same event drives both. The absence of Granger causality strongly supports this interpretation. Finally, the linear model may be misspecified; volatility-volume relationships in finance literature (e.g., the Mixture of Distributions Hypothesis) often suggest log-linear or threshold-based functional forms.
Actionable Insights and Further Investigation Given that 80% of VIX variance is unexplained and no Granger causality exists, volume alone is a poor predictor of VIX. Practitioners should not use Tape B volume as a leading indicator for volatility trading strategies. However, the contemporaneous correlation (r ≈ 0.45) suggests potential value in real-time, intraday analysis — if same-period spikes in Tape B volume co-occur with VIX jumps, this could inform intraday risk monitoring. Future investigation should: (1) expand to multi-year data to test whether 2012's calm regime suppresses a stronger relationship; (2) apply log transformations to both variables, as financial time series typically exhibit log-normal distributions; (3) incorporate additional volume tapes (A, C) alongside Tape B for a more complete market picture; (4) test for regime-switching models separating high-stress from low-stress market environments; and (5) control for confounders such as time-of-year effects, major macro announcements, and options expiration cycles that likely drive both variables simultaneously.
X dataset: Cboe U.S. Equities Historical Market Volume Data 2012
Y dataset: VIX Volatility Index Daily (FRED)
Part of experiment: Daily - Cboe U.S. Equities Historical Market Volume Data 2012 vs VIX Volatility Index Daily (FRED)