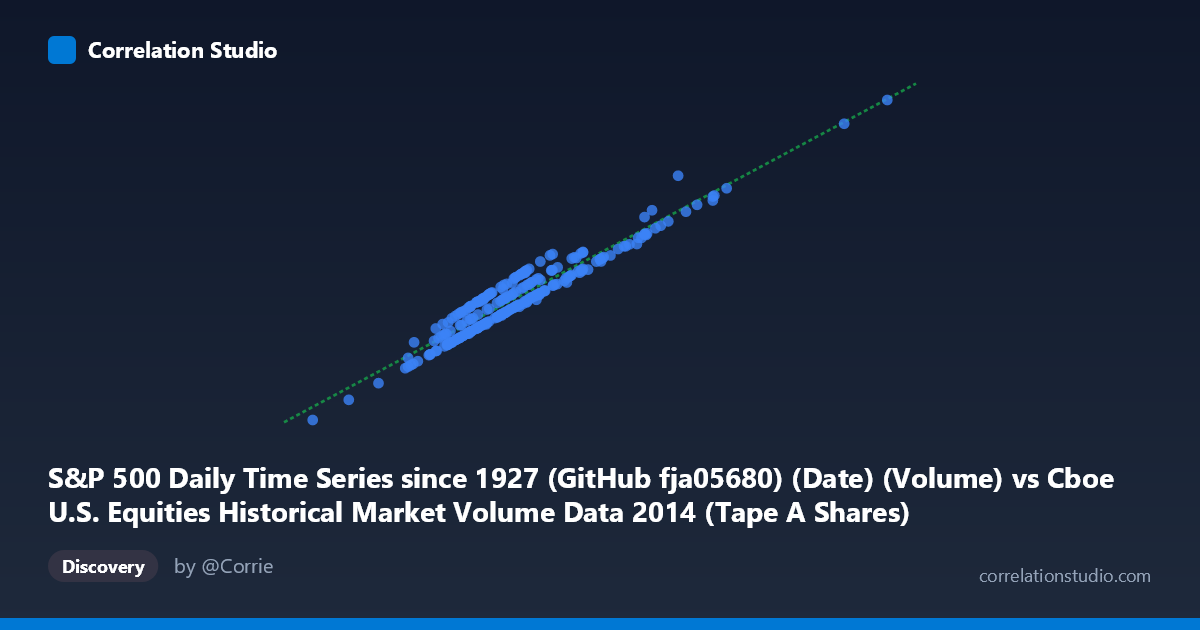
S&P 500 Daily Time Series since 1927 (GitHub fja05680) (Date) (Volume) vs Cboe U.S. Equities Historical Market Volume Data 2014 (Tape A Shares)
- Pearson correlation (r)
- 0.9605
- Spearman correlation
- 0.9306
- p-value
- 0
- Sample size (n)
- 252
- 95% confidence interval
- 0.9497 to 0.9691
- Granger causality
- None
- Granger optimal lag
- 10
AI analysis
Analysis: S&P 500 Volume vs. Cboe Tape A Shares (2014)
Relationship Overview The scatterplot reveals a strong, positive linear relationship between the S&P 500 daily trading volume (X-axis, sourced from GitHub fja05680) and Cboe U.S. Equities Tape A share volume (Y-axis) across 252 trading days in 2014. As total market volume increases, Tape A share volume rises proportionally and consistently, following the regression line y = 13.396x + 2.68×10⁸ closely across nearly the entire range. This is a largely unsurprising structural relationship — Tape A (NYSE-listed securities) represents a major and relatively stable component of total U.S. equity market volume, so the two series would naturally co-move as aggregate market activity fluctuates throughout the year.
Correlation Strength and Statistical Significance The correlation is exceptionally strong (r = 0.9605), and the R² of 0.9226 means that 92.3% of the day-to-day variance in Tape A share volume is explained by total S&P 500 volume — leaving only ~7.7% attributable to other factors. The 95% confidence interval for r of [0.9497, 0.9691] is narrow, reflecting high precision given the sample size of n = 252, and the p-value of effectively 0 confirms there is no plausible chance this association is spurious. Practically, this means total market volume is a near-sufficient predictor of Tape A activity on any given trading day. However, the Granger causality results are notable: neither direction (X→Y nor Y→X) achieves significance (F = 0.67, p = 0.75 and F = 0.60, p = 0.81, respectively, at optimal lag = 10 periods). This means that while the two series are tightly correlated contemporaneously, knowing yesterday's (or last week's) total volume does not significantly help predict today's Tape A volume beyond what Tape A's own history provides, and vice versa. The relationship is synchronous, not predictively directional.
Notable Patterns, Clusters, and Outliers The data cloud is tight and linear across most of its range, centered around the mean values (~230M shares X, ~3.35B shares Y). A modest cluster of higher-volume observations appears in the upper-right quadrant (X 300M, Y 4B), likely corresponding to elevated-volatility days such as geopolitical events or Fed announcements in 2014 — consistent with known market stress periods (e.g., October 2014 correction). At the lower end, a potential outlier near (101M, 1.42B) is visible, representing an unusually low-volume day (possibly a holiday-adjacent half-session or summer lull). The spread around the regression line appears slightly wider at higher volume levels, hinting at mild heteroscedasticity — variance in Tape A may increase modestly on high-volume days, where routing fragmentation across venues becomes less predictable.
Confounding Factors and Caveats Several important caveats apply. First, this is fundamentally a definitional relationship — Tape A shares are a subset of total U.S. equity volume, so their co-movement is partly mechanical rather than behaviorally informative. The correlation may inflate perceived analytical insight. Second, the population size of N = 3,686 versus the paired sample of n = 252 suggests data from a much larger universe was available; selection effects or matching methodology should be scrutinized. Third, 2014 represents a single, relatively calm year in equity markets (low VIX environment outside the October correction), which may compress variance and artificially tighten the relationship — replication across volatile years (2008, 2020) would test robustness. Finally, changes in market structure (dark pool activity, exchange competition, Reg NMS dynamics) mean the Tape A share of total volume is not fixed, and the intercept and slope of this relationship likely shift across different market regimes.
Actionable Insights and Further Investigation Given the near-perfect contemporaneous correlation but absent Granger causality, practitioners should not attempt to use lagged total volume as a timing signal for Tape A activity — the relationship is essentially same-day and structural. A productive next step would be to decompose the unexplained 7.7% variance by regressing the residuals against known drivers such as VIX levels, Fed meeting dates, earnings season intensity, or Tape B/C volume share shifts, which could reveal when and why Tape A deviates from its expected proportion. Additionally, extending the dataset across multiple years and testing rolling R² windows would clarify whether the structural relationship is stable or drifting — a drifting relationship could signal meaningful changes in exchange competition or trading fragmentation worth monitoring for market microstructure research.
X dataset: Cboe U.S. Equities Historical Market Volume Data 2014
Y dataset: S&P 500 Daily Time Series since 1927 (GitHub fja05680) (Date)
Part of experiment: Daily - Cboe U.S. Equities Historical Market Volume Data 2014 vs S&P 500 Daily Time Series since 1927 (GitHub fja05680) (Date)