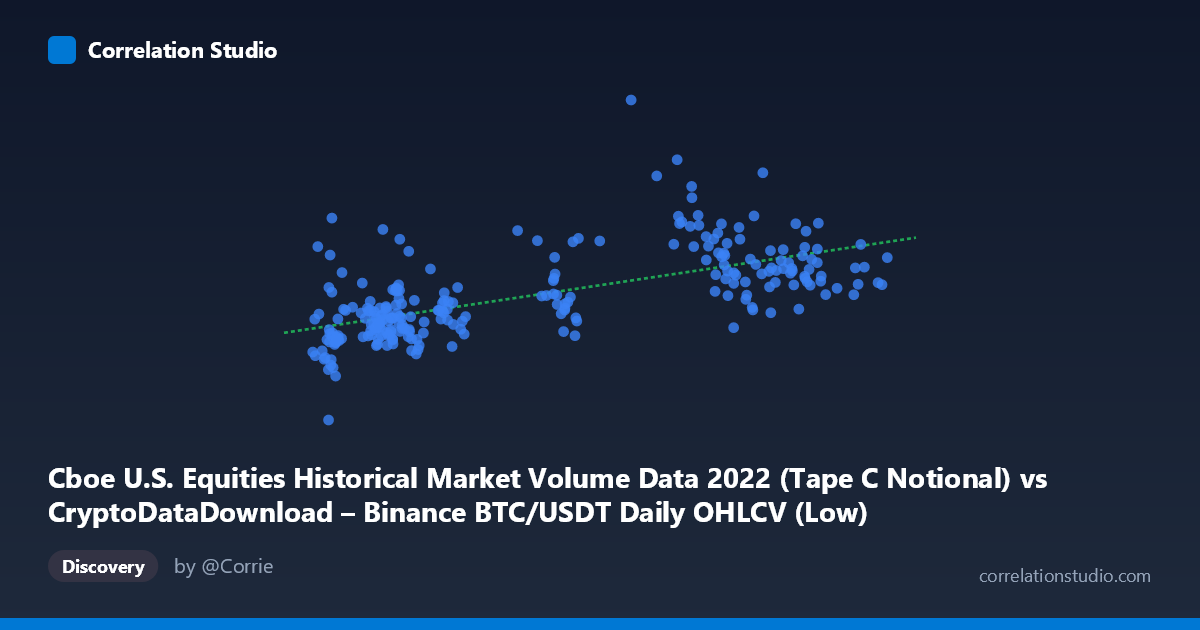
Cboe U.S. Equities Historical Market Volume Data 2022 (Tape C Notional) vs CryptoDataDownload – Binance BTC/USDT Daily OHLCV (Low)
- Pearson correlation (r)
- 0.6384
- Spearman correlation
- 0.6683
- p-value
- 0
- Sample size (n)
- 251
- 95% confidence interval
- 0.5587 to 0.7063
- Granger causality
- None
- Granger optimal lag
- 10
AI analysis
Analysis: Cboe U.S. Equities Volume vs. BTC/USDT Daily Low
1. What the Visualization Reveals
The scatterplot shows a positive, moderate-strength relationship between two variables that, notably, come from entirely different financial ecosystems: U.S. equities market volume (Cboe/Tape C notional) and Bitcoin's daily low price on Binance. Despite the mismatched domains, the data show a discernible upward trend — as equities notional volume increases, BTC's daily low tends to increase as well. However, the scatter around the regression line is substantial, indicating this is far from a tight, deterministic relationship.
2. Strength, Direction, and Statistical Confidence
The correlation coefficient (r = 0.638) indicates a moderate positive relationship, with r² = 0.4075 meaning only about 41% of the variance in BTC's daily low is explained by equities volume — leaving the majority (59%) attributable to other factors. The 95% confidence interval [0.559, 0.706] is reasonably tight and does not cross zero, and the p-value (effectively 0) confirms this correlation is statistically significant and not due to chance, given the 251-day sample. However, statistical significance should not be conflated with practical predictive power — a moderate r² leaves considerable room for divergence between the two series on any given day.
Critically, the Granger causality test shows no significant predictive direction in either direction (X→Y: p=0.590; Y→X: p=0.383). This is an important finding: even though the two series are correlated contemporaneously, neither variable's past values help forecast the other's future values at the tested lag structure (optimal lag = 10 periods). This strongly suggests the relationship is not causal in a temporal/mechanistic sense — it's more likely that both variables are responding to a shared external driver (see confounders below) rather than one influencing the other.
3. Patterns, Clusters, and Outliers
Visually, the data separate into loose clusters by X-value: a low-X cluster (~15,000–23,000) with BTC lows mostly in the $9B–13B range, and a high-X cluster (~35,000–46,000) with BTC lows spread more widely ($13B–22B). This bimodal X-distribution (rather than continuous spread) suggests equities volume itself clustered into "low-volume" and "high-volume" regimes during 2022 — possibly corresponding to different market periods (e.g., calmer vs. volatile months). Within the high-X cluster, variance in Y is large (13B to 22B), indicating equities volume alone doesn't tightly constrain BTC's low price in that regime. A few points stand out as outliers — e.g., (35440, 22.09B) and (20246, 16.54B) — where BTC lows are unusually high relative to their X-cluster, suggesting BTC-specific volatility events decoupled from equities activity.
4. Confounding Factors and Caveats
This pairing is a classic case of potential spurious correlation via a common confounder: both equities market volume and BTC price levels are likely driven by macro factors in 2022 — Fed rate hikes, inflation data, risk-on/risk-off sentiment shifts, and general market volatility (VIX spikes). 2022 was marked by synchronized selloffs across risk assets, so elevated volume in equities (often a signature of volatility/selloff days) coinciding with BTC price levels doesn't imply a direct link between Binance crypto trading and Cboe equities microstructure. Additionally, comparing a volume metric (notional dollars traded) to a price level (BTC low) is somewhat apples-to-oranges — it may be more meaningful to compare volume-to-volume or price-to-price, or to detrend both series (2022 had a strong secular BTC decline that could conflate with time-varying equity volume trends).
5. Actionable Insights and Further Investigation
Given the lack of Granger causality, this correlation should not be used for predictive trading signals in either direction. Instead, treat it as evidence of shared macro sensitivity. Recommended next steps: (1) test both series against a common macro proxy (e.g., VIX, DXY, or Fed funds rate) to identify the true shared driver; (2) run the analysis on detrended or differenced data to remove spurious correlation from shared downward 2022 trends; (3) segment the analysis by identified regime clusters (low-X vs. high-X periods) to see if the relationship strengthens or weakens conditionally; and (4) compare BTC price against equities volatility rather than volume, which may be a more theoretically justified pairing given 2022's risk-off macro environment.
X dataset: CryptoDataDownload – Binance BTC/USDT Daily OHLCV
Y dataset: Cboe U.S. Equities Historical Market Volume Data 2022
Part of experiment: Bitcoin - CryptoDataDownload – Binance BTC/USDT Daily OHLCV vs Cboe U.S. Equities Historical Market Volume Data 2022