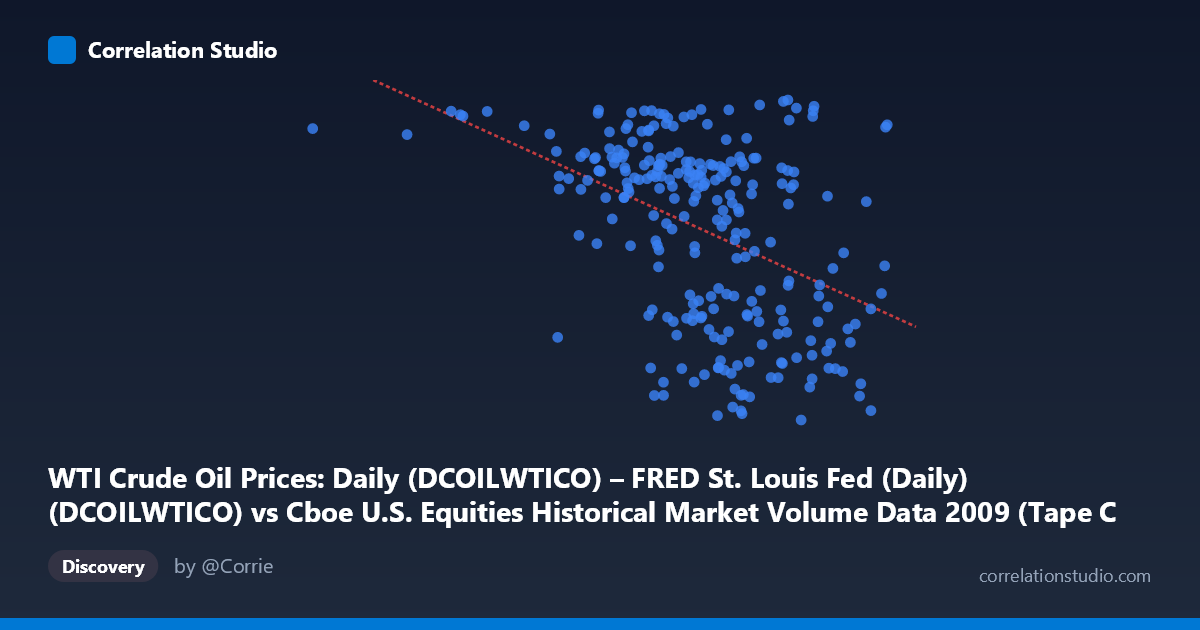
WTI Crude Oil Prices: Daily (DCOILWTICO) – FRED St. Louis Fed (Daily) (DCOILWTICO) vs Cboe U.S. Equities Historical Market Volume Data 2009 (Tape C Trade Count)
- Pearson correlation (r)
- -0.4325
- Spearman correlation
- -0.43
- p-value
- 0
- Sample size (n)
- 252
- 95% confidence interval
- -0.5279 to -0.3264
- Granger causality
- None
- Granger optimal lag
- 1
AI analysis
Analysis: WTI Crude Oil Prices vs. Cboe Tape C Trade Count (2009)
Relationship Overview The scatterplot reveals a moderate negative relationship between WTI crude oil prices (X-axis) and Cboe Tape C trade counts (Y-axis) across 252 paired trading days in 2009. As oil prices rise, equity trade counts on Tape C tend to decline, and the regression line (y = −5.79×10⁻⁵x + 98.77) captures this downward slope visually. Notably, the data is spread across a wide price range — from roughly $34 to $81 per barrel — reflecting 2009's dramatic oil price recovery from post-financial-crisis lows. The relationship is visible but far from clean, with considerable scatter around the regression line suggesting meaningful noise in the association.
Correlation Strength, Direction, and Statistical Significance The Pearson correlation of r = −0.4325 indicates a moderate negative association, but the explanatory power is relatively modest: r² = 0.1871, meaning only about 18.7% of the variance in Tape C trade counts is explained by oil price levels. The remaining ~81% is attributable to other factors entirely. The 95% confidence interval of [−0.5279, −0.3264] is reasonably tight and does not cross zero, and the p-value of 6.5×10⁻¹³ — with a population of N = 3,232 — confirms the association is highly statistically significant and almost certainly not a chance finding. However, statistical significance here is partly a function of the large population size; practical significance remains limited. Critically, the Granger causality tests show no significant temporal predictive direction in either direction (X→Y: p = 0.245; Y→X: p = 0.179), meaning that neither series reliably predicts the other's future values at the tested lags. This is an important caveat: the correlation reflects a contemporaneous association, not a causal or predictive relationship.
Notable Patterns, Clusters, and Outliers The sample points reveal several structural features worth noting. There appears to be a loose clustering of high trade counts (Y 65) concentrated at lower-to-mid oil prices (~$35–$60/barrel), while higher oil prices ($70+) tend to associate with lower trade counts, consistent with the negative slope. A few apparent outliers stand out: the point near (185,886, 76.83) sits far to the left of the main data cloud — this extremely low oil price value (likely reflecting early 2009 distressed pricing) combined with a relatively high trade count could be exerting leverage on the regression. Additionally, points like (764,138, 80.11) and (743,745, 79.84) show high trade counts at higher oil prices, representing notable deviations from the trend. The overall scatter is wide enough to suggest a non-linear or regime-dependent relationship may be present — particularly given that 2009 spans both a market crisis trough and a recovery phase.
Confounding Factors and Caveats Several important confounders complicate interpretation. 2009 was an extraordinary year — the global financial crisis trough occurred in early March, followed by a sustained equity and commodity rally. Both oil prices and equity trading volumes were heavily influenced by the same macroeconomic shock (risk-on/risk-off sentiment), meaning the observed correlation may be spuriously driven by a shared third variable: broad market risk appetite or the VIX. Additionally, Tape C specifically represents NYSE Arca-listed securities, which have a particular composition bias (ETFs, tech stocks) that may not generalize. The axes in the data summary appear to have descriptions swapped between datasets (the X-axis label references FRED oil data while the Y-axis description references Cboe data), which warrants verification of data alignment. Furthermore, daily trade counts are subject to seasonality, option expiration cycles, and index rebalancing effects that are unrelated to oil prices.
Actionable Insights and Further Investigation Given that oil prices explain less than 19% of trade count variance and show no Granger-causal relationship, practitioners should avoid using oil prices as a standalone predictor of equity trading activity. However, the moderate correlation is worth investigating further in a multivariate framework — controlling for VIX, S&P 500 returns, and broader macroeconomic indicators would help isolate whether oil has any independent explanatory power. It would be valuable to test for structural breaks around March 2009 (the market bottom) to determine whether the correlation differs in crisis versus recovery regimes. Examining other Tape designations (A and B) for comparison could reveal whether this relationship is specific to NYSE Arca listings. Finally, a rolling-window correlation analysis across multiple years would determine whether this 2009 finding is anomalous or reflects a persistent structural relationship between commodity prices and equity market microstructure.
X dataset: Cboe U.S. Equities Historical Market Volume Data 2009
Y dataset: WTI Crude Oil Prices: Daily (DCOILWTICO) – FRED St. Louis Fed (Daily)
Part of experiment: Daily - Cboe U.S. Equities Historical Market Volume Data 2009 vs WTI Crude Oil Prices: Daily (DCOILWTICO) – FRED St. Louis Fed (Daily)