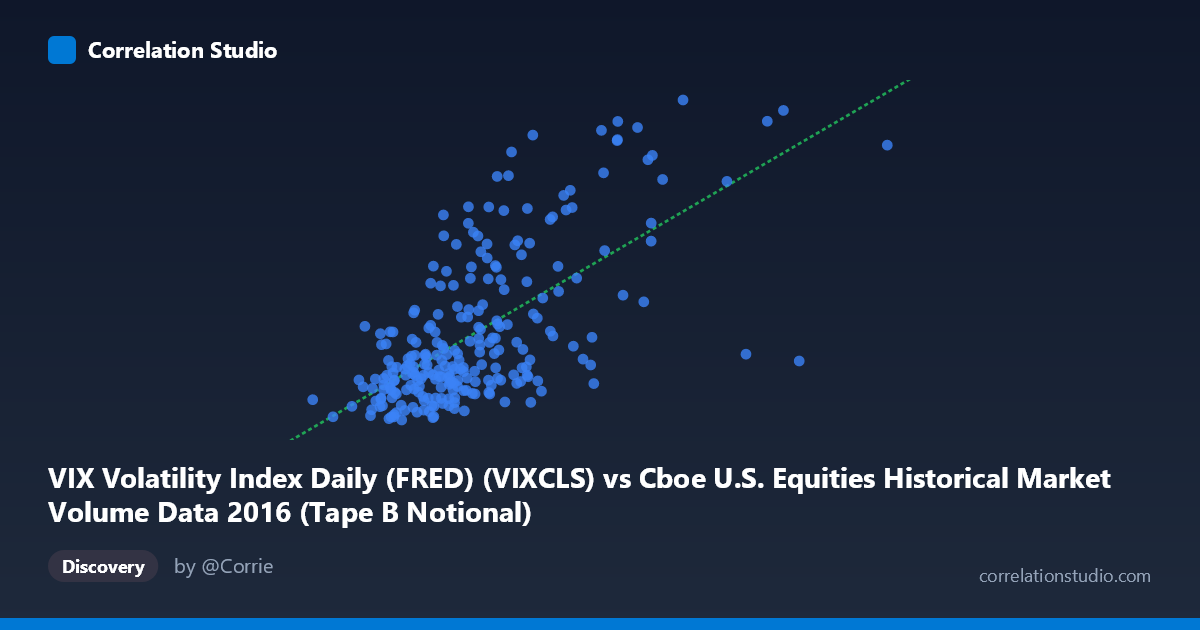
VIX Volatility Index Daily (FRED) (VIXCLS) vs Cboe U.S. Equities Historical Market Volume Data 2016 (Tape B Notional)
- Pearson correlation (r)
- 0.6507
- Spearman correlation
- 0.5968
- p-value
- 0
- Sample size (n)
- 252
- 95% confidence interval
- 0.5732 to 0.7166
- Granger causality
- None
- Granger optimal lag
- 1
AI analysis
Analysis: VIX Volatility Index vs. Tape B Notional Trading Volume (2016)
Relationship Overview
The scatterplot reveals a positive relationship between Cboe Tape B notional trading volume (X-axis) and the VIX Volatility Index (Y-axis) across 252 trading days in 2016. As market volume increases, implied volatility tends to rise as well — a relationship that aligns intuitively with market microstructure theory: elevated uncertainty and fear drive both higher options-implied volatility and greater overall trading activity. The linear regression equation (y = 1.657e-9·x + 7.467) suggests that for every ~600 million dollar increase in notional volume, the VIX rises by approximately one point, though the relationship is clearly noisy at lower volume levels.
Correlation Strength and Statistical Significance
The Pearson correlation of r = 0.651 indicates a moderate-to-strong positive association, and with r² = 0.4234, roughly 42% of the variance in VIX is explained by Tape B notional volume — a meaningful but incomplete picture, leaving 58% of VIX variation unexplained by this single predictor. The 95% confidence interval for r of [0.573, 0.717] is relatively tight, and the p-value of essentially zero across n = 252 paired observations confirms the correlation is highly statistically significant and not attributable to chance. However, the Granger causality results tell a more cautious story: neither direction of temporal predictive causality is statistically significant (X→Y: F = 0.0004, p = 0.984; Y→X: F = 0.032, p = 0.857). This means that while the two variables are contemporaneously correlated, neither reliably predicts future values of the other with a one-period lag — a critical distinction between correlation and actionable forecasting signal.
Notable Patterns, Clusters, and Outliers
The data exhibits a heteroscedastic fan shape: points cluster tightly at lower volume levels (roughly 3–5 billion in notional value, VIX 11–16), while dispersion widens dramatically at higher volumes. Several high-leverage outliers are visible in the upper-right quadrant — most notably two points near x = 8.0–8.2 billion with VIX readings of ~26.7 and ~17.5, and another near x = 6.7 billion at VIX ~23. These likely correspond to specific volatility episodes in 2016 (e.g., Brexit in late June, the U.S. presidential election in November), where fear spiked and trading volume surged simultaneously. Conversely, a cluster of points exists at relatively high volume (x 6 billion) but moderate VIX (~12–19), suggesting volume alone is not a reliable proxy for fear. The relationship also shows possible non-linearity — a curve or threshold effect may fit better than the linear model, particularly at the extremes.
Confounding Factors and Caveats
Several important caveats limit causal interpretation. First, Tape B notional volume captures only a subset of U.S. equities market activity (Nasdaq-listed securities traded on non-primary venues), making it a partial proxy for total market participation. Second, 2016 was an atypical year with discrete macro shocks (Brexit, U.S. elections, Fed rate decisions) that simultaneously elevated both VIX and trading volume — these events act as common drivers that inflate the observed correlation without implying a direct causal link. Third, the axes in the original dataset appear to be swapped relative to convention (VIX as Y driven by volume as X), though the economic relationship could plausibly run in either direction or be bidirectional. Finally, the Granger non-result at lag-1 may simply reflect that intraday or same-day dynamics dominate this relationship, which daily data cannot capture.
Actionable Insights and Further Investigation
Practitioners should avoid using Tape B volume alone as a VIX forecasting tool given the lack of Granger causality — the relationship is contemporaneous, not predictive at daily lags. However, the strong r² of 0.42 makes this pairing useful for regime characterization: high-volume, high-VIX days likely signal stressed market conditions warranting risk-reduction. Further investigation should include: (1) testing multiple Granger lags beyond lag-1 to check for slower predictive dynamics; (2) segmenting the analysis by pre/post Brexit and pre/post election to test whether the correlation is driven primarily by event windows; (3) fitting a non-linear (log or polynomial) model to better capture the fan-shaped heteroscedasticity; and (4) incorporating total market notional volume across all tapes to assess whether Tape B's partial picture meaningfully underestimates the true relationship.
X dataset: Cboe U.S. Equities Historical Market Volume Data 2016
Y dataset: VIX Volatility Index Daily (FRED)
Part of experiment: Daily - Cboe U.S. Equities Historical Market Volume Data 2016 vs VIX Volatility Index Daily (FRED)