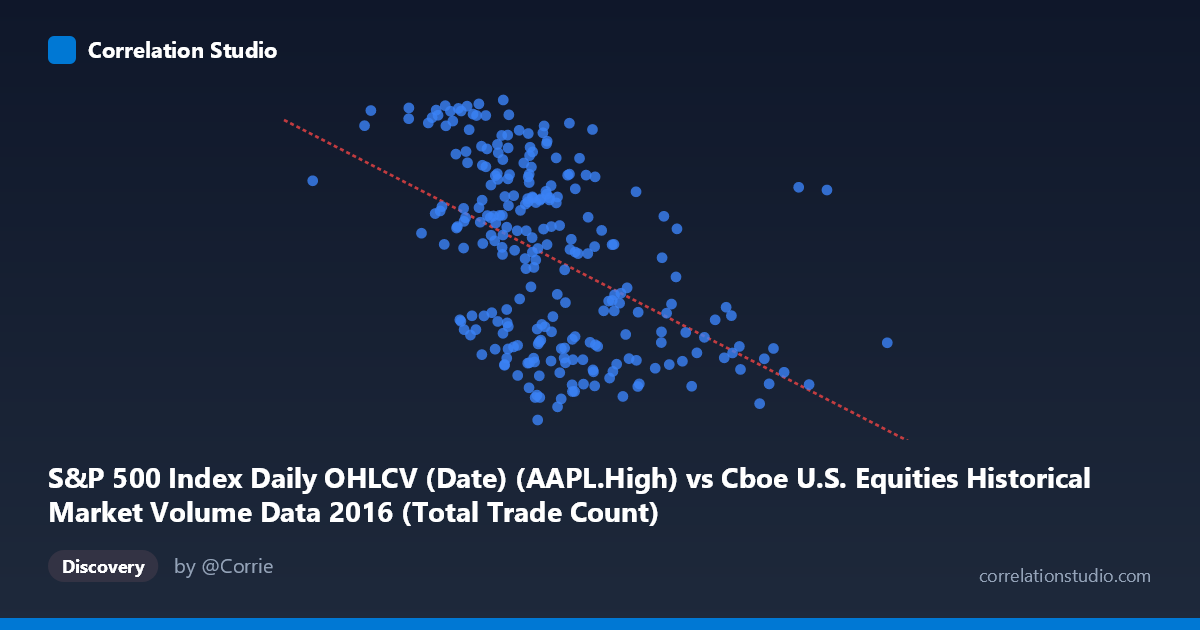
S&P 500 Index Daily OHLCV (Date) (AAPL.High) vs Cboe U.S. Equities Historical Market Volume Data 2016 (Total Trade Count)
- Pearson correlation (r)
- -0.4896
- Spearman correlation
- -0.5168
- p-value
- 0
- Sample size (n)
- 252
- 95% confidence interval
- -0.5782 to -0.3896
- Granger causality
- None
- Granger optimal lag
- 1
AI analysis
Analysis: AAPL High Price vs. Cboe Total Trade Count (2016)
Relationship Overview The scatterplot reveals a negative relationship between Apple's daily high stock price (X-axis) and the Cboe U.S. Equities total trade count (Y-axis) across 252 trading days in 2016. As AAPL's high price increases, the total number of trades on Cboe exchanges tends to decline. This is a somewhat counterintuitive finding at first glance — higher AAPL prices are associated with fewer total market trades — but it likely reflects broader market dynamics rather than a direct causal mechanism. The linear regression equation (y = -6.99×10⁻⁶x + 122.36) confirms a shallow but consistent negative slope across the observed price range of roughly $94 to $119.
Correlation Strength and Statistical Significance The Pearson correlation of r = -0.49 indicates a moderate negative association, and the R² of 0.24 means that approximately 24% of the variance in total trade count is explained by AAPL's high price alone — meaningful but leaving 76% of variation unexplained by this single predictor. The 95% confidence interval of [-0.578, -0.390] is entirely negative, and the p-value of 2.22×10⁻¹⁶ confirms the relationship is highly statistically significant, effectively ruling out chance as an explanation. However, statistical significance should not be confused with practical magnitude — a quarter of explained variance is modest. Critically, the Granger causality tests return no significant directional predictability in either direction (X→Y: F=0.93, p=0.34; Y→X: F=0.97, p=0.33), meaning that knowing today's AAPL high price does not meaningfully improve forecasts of tomorrow's trade count, and vice versa. The correlation reflects co-movement, not temporal leadership by either variable.
Patterns, Clusters, and Outliers The sample points reveal notable vertical dispersion at mid-range X values (roughly $2.1M–$2.5M range in raw units), suggesting high variability in trade counts even when AAPL prices are similar. There appear to be two loose clusters: one at lower AAPL prices (~$92–$100) paired with moderate-to-low trade counts, and another at higher prices (~$110–$118) that shows a wide spread. Several potential outliers are visible — points with very high trade counts (115) occurring at both low and high AAPL prices suggest episodic spikes in market activity that are decoupled from price level. A few extreme X values (above $3.5M) consistently appear at lower trade counts, pulling the regression line and potentially inflating the apparent correlation strength.
Confounding Factors and Caveats This correlation almost certainly reflects shared temporal structure rather than a direct economic link. Both series are time-ordered through 2016, and AAPL's price trajectory (generally rising through the year) may be inversely mirroring a secular decline in fragmented trade counts — a well-documented trend as market structure evolved. Seasonality, macroeconomic events, earnings announcements, and index rebalancing days could simultaneously drive both variables, creating spurious correlation. The dataset labels also suggest a possible axis mislabeling or dataset join artifact — the X-axis references AAPL High from an S&P 500 dataset while the Y-axis pulls trade count from a Cboe dataset — warranting verification that the date alignment is correct and no look-ahead bias exists in the pairing.
Actionable Insights and Further Investigation Given the lack of Granger causality, this correlation should not be used for predictive trading strategies in its current form. Recommended next steps include: (1) decomposing both series by removing time trends to test whether the correlation persists in the residuals, which would confirm it is not purely a spurious temporal artifact; (2) including additional market variables (VIX, S&P 500 volume, Fed announcements) to build a multivariate model and isolate AAPL's marginal contribution; (3) testing non-linear specifications, as the scatter suggests possible threshold effects at extreme price levels; and (4) validating the dataset join to confirm correct date alignment between the Cboe and S&P 500 source files. The moderate R² is intriguing enough to warrant deeper structural analysis, but the absence of Granger causality is a firm caution against over-interpreting the directionality of this relationship.
X dataset: Cboe U.S. Equities Historical Market Volume Data 2016
Y dataset: S&P 500 Index Daily OHLCV (Date)
Part of experiment: Daily - Cboe U.S. Equities Historical Market Volume Data 2016 vs S&P 500 Index Daily OHLCV (Date)