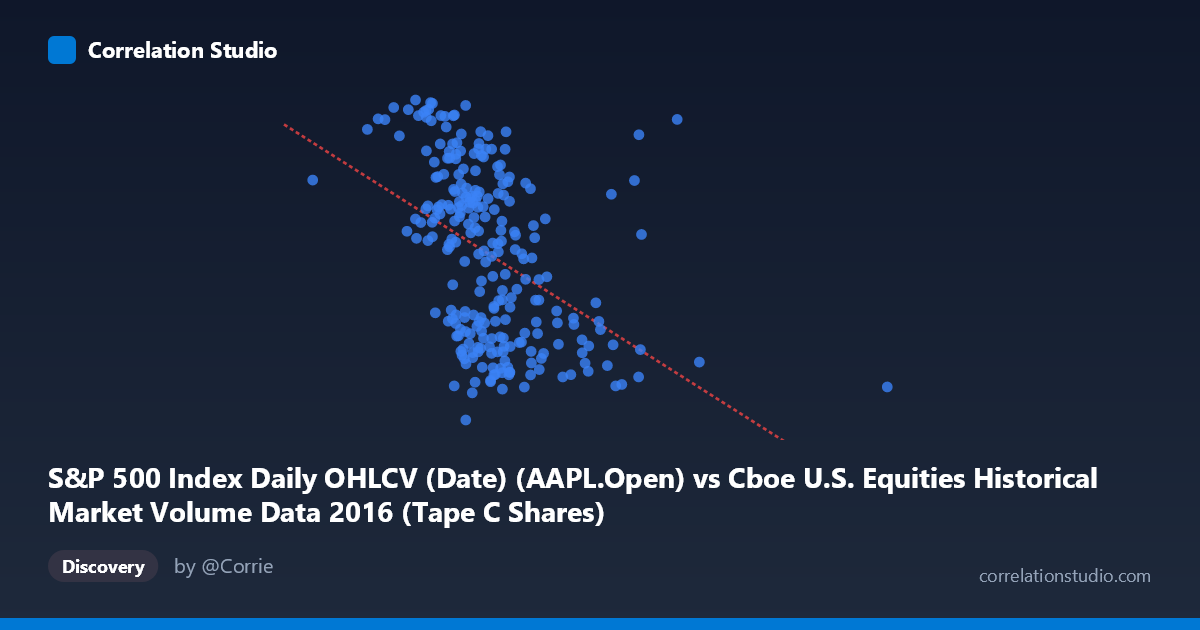
S&P 500 Index Daily OHLCV (Date) (AAPL.Open) vs Cboe U.S. Equities Historical Market Volume Data 2016 (Tape C Shares)
- Pearson correlation (r)
- -0.4355
- Spearman correlation
- -0.4969
- p-value
- 0
- Sample size (n)
- 252
- 95% confidence interval
- -0.5305 to -0.3297
- Granger causality
- None
- Granger optimal lag
- 1
AI analysis
Scatterplot Analysis: AAPL Opening Price vs. Cboe Tape C Share Volume (2016)
Relationship Overview The scatterplot reveals a negative relationship between Apple's (AAPL) daily opening price on the S&P 500 and Cboe Tape C share volume throughout 2016. As AAPL's opening price increases, Tape C share volume tends to decline, and vice versa. The linear regression equation (y = -1.2131E⁻⁰⁷x + 120.637) quantifies this inverse trend, suggesting that for every ~$8 increase in AAPL's opening price, Tape C volume decreases by approximately one unit. Visually, the data points show a downward-sloping cloud, though with considerable scatter around the trend line, indicating the relationship is real but far from deterministic.
Correlation Strength and Statistical Significance The Pearson correlation of r = -0.4355 reflects a moderate negative association. However, the R² value of 0.1897 means only about 19% of the variance in Tape C share volume is explained by AAPL's opening price — leaving roughly 81% attributable to other factors. While modest in explanatory power, this relationship is statistically robust: the p-value of 4.35E-13 is extraordinarily small, making it virtually certain this is not a chance finding given n = 252 paired observations. The 95% confidence interval for r of [-0.53, -0.33] is reasonably tight and entirely negative, confirming the directional conclusion is reliable. Practically, this means while the inverse relationship is genuine and repeatable, it is a weak-to-moderate signal that should not be used in isolation for predictive purposes.
Granger Causality and Temporal Direction Despite the statistically significant correlation, Granger causality tests reveal no significant temporal predictive direction in either direction (X→Y: F = 1.40, p = 0.238; Y→X: F = 0.53, p = 0.465). This is a critical finding: knowing AAPL's opening price today does not meaningfully help predict tomorrow's Tape C volume, nor does Tape C volume help predict AAPL's next-day opening price. The correlation appears to be a contemporaneous co-movement — both variables likely respond to the same underlying market conditions simultaneously — rather than one variable driving the other with a temporal lag. This effectively rules out a simple causal trading strategy built on this relationship.
Notable Patterns, Clusters, and Outliers The sample points highlight several notable features. There is a dense cluster of observations in the AAPL price range of approximately $105–$135 (corresponding to mid-2016 trading), where volume variability is highest, suggesting other forces dominate volume in that price band. A handful of potential outliers appear at lower AAPL price levels (below ~$95M equivalent open values) paired with relatively high Tape C volumes (above 115), which may correspond to early 2016 market stress periods when AAPL sold off sharply. The upper-right portion of the chart — higher AAPL prices combined with higher volumes — is notably sparse, consistent with the negative trend. The scatter also appears somewhat heteroscedastic, with volume variability widening at mid-range AAPL prices, suggesting a non-constant relationship across price regimes.
Caveats, Confounders, and Further Investigation Several important caveats temper interpretation. First, spurious correlation driven by shared macro drivers is highly plausible: both AAPL's price and overall equity market volume respond to volatility regimes, Federal Reserve policy shifts, and macroeconomic events in 2016 (e.g., Brexit in June, the U.S. election in November). Second, Tape C volume is a broad market measure, not specific to AAPL, so the relationship may reflect market-wide risk-off behavior (high volume, falling prices) rather than anything AAPL-specific. Third, the dataset spans only one calendar year, limiting generalizability. For further investigation, it would be valuable to: (1) partial out market-wide volatility (VIX) to test whether the relationship persists after controlling for macro conditions; (2) segment the data by quarter or event window to identify whether the correlation is driven by specific episodes; and (3) test nonlinear models, given the heteroscedastic scatter, to determine whether a regime-switching or polynomial fit better captures the underlying dynamics.
X dataset: Cboe U.S. Equities Historical Market Volume Data 2016
Y dataset: S&P 500 Index Daily OHLCV (Date)
Part of experiment: Daily - Cboe U.S. Equities Historical Market Volume Data 2016 vs S&P 500 Index Daily OHLCV (Date)