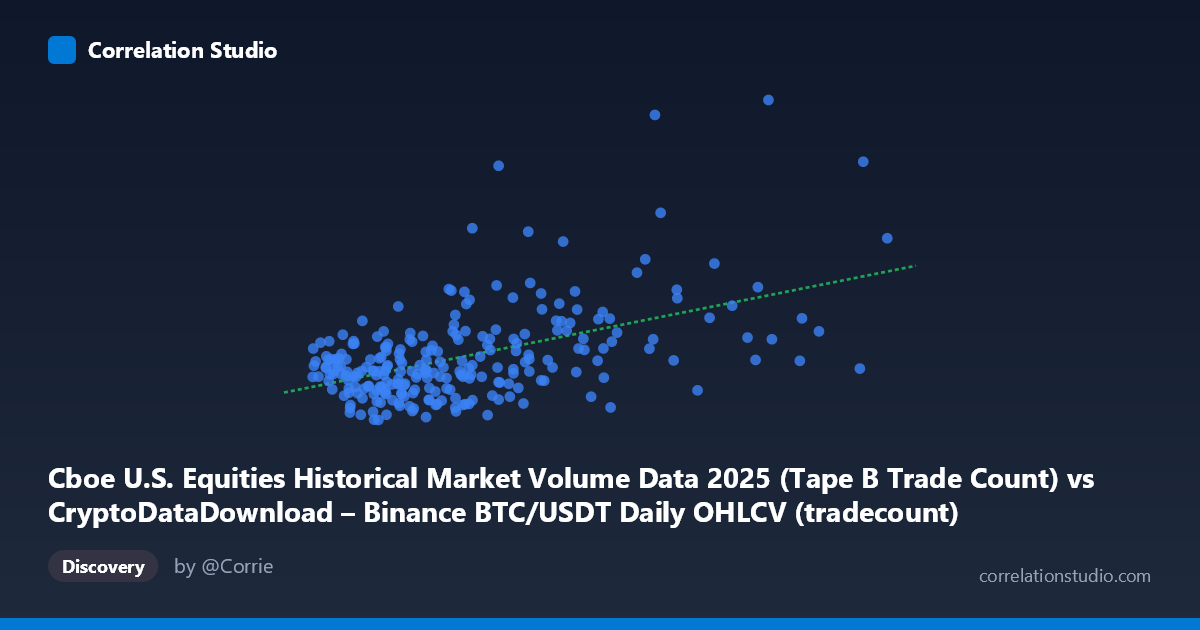
Cboe U.S. Equities Historical Market Volume Data 2025 (Tape B Trade Count) vs CryptoDataDownload – Binance BTC/USDT Daily OHLCV (tradecount)
- Pearson correlation (r)
- 0.504
- Spearman correlation
- 0.396
- p-value
- 0
- Sample size (n)
- 250
- 95% confidence interval
- 0.4053 to 0.5911
- Granger causality
- None
- Granger optimal lag
- 10
AI analysis
Analysis: Cboe Equities Trade Count vs. Binance BTC/USDT Trade Count
1. What the Visualization Reveals
The scatterplot shows a positive, moderate-strength linear relationship between Cboe U.S. equities trade counts and Binance BTC/USDT trade counts across 250 paired daily observations. Points cluster in a diagonal band trending upward from lower-left to upper-right, with the bulk of observations concentrated in the X range of 2–4 million (equities trade count) and Y range of 450,000–800,000 (crypto trade count). A smaller number of higher-X observations (6–12 million) extend the relationship into a sparser tail, which has meaningful leverage on the fitted regression line.
2. Strength, Direction, and Statistical Confidence
The correlation coefficient (r = 0.504) indicates a moderate positive association, with r² = 0.254 meaning only about 25% of the variance in Binance trade counts is statistically explained by Cboe equities trade counts — leaving roughly 75% attributable to other factors. The 95% CI [0.405, 0.591] is reasonably tight and does not cross zero, and the p-value (effectively 0) confirms this correlation is highly unlikely to be due to chance given the sample size. However, statistical significance ≠ practical strength: this is a moderate, not strong, relationship. Critically, the Granger causality tests show no significant predictive direction in either direction (X→Y: p=0.89; Y→X: p=0.48) at the optimal 10-period lag. This means neither series reliably helps forecast the other's future values — the correlation is likely contemporaneous/coincidental rather than causal or lead-lag in nature.
3. Notable Patterns and Outliers
The data shows a dense core cluster (X: 2–4M, Y: 450K–750K) with a fairly linear trend, but several high-leverage points stand out — observations near X = 7.5M–9.8M (Y ≈ 738K–1.07M) sit apart from the main cluster and likely disproportionately drive the slope estimate. There's also visible heteroscedasticity: variance in Y appears to increase as X increases, suggesting the relationship may not be uniformly linear across the full range. No strong evidence of a curved (non-linear) pattern is apparent, but the scatter within the dense cluster is wide, meaning for any given X value, Y varies substantially (consistent with the modest r²).
4. Confounding Factors and Caveats
Both series are trade-count metrics from entirely different asset classes and market structures (traditional equities vs. crypto), making a direct causal link mechanistically unclear. A major likely confound is shared exogenous drivers — both markets respond to macro volatility events, risk-on/risk-off sentiment, major news days, holidays, and overall market activity cycles, which would produce correlated trade-count spikes without one market driving the other. Additionally, comparing daily aggregated counts ignores time-of-day/session mismatches (Cboe operates on U.S. equity market hours; Binance trades 24/7), and the small sample (n=250) drawn from a larger population (N=3,212) may not fully capture seasonal or regime-specific dynamics across all of 2025.
5. Suggestions for Further Investigation
Given the lack of Granger causality, treat this correlation as descriptive, not predictive — it should not be used to forecast one market from the other. Future analysis should: (a) test for correlation with common macro variables (VIX, overall market volume indices) to identify shared confounders; (b) examine whether the relationship is driven by a subset of high-volatility days (e.g., segment analysis on the high-X outliers) using robust or quantile regression; (c) explore non-daily granularity or intraday alignment to check for lagged effects Granger tests may have missed; and (d) apply a rolling-window correlation to see if the relationship strengthens/weakens during specific volatility regimes (e.g., major crypto news events or equity market stress periods) in 2025.
X dataset: CryptoDataDownload – Binance BTC/USDT Daily OHLCV
Y dataset: Cboe U.S. Equities Historical Market Volume Data 2025
Part of experiment: Bitcoin - CryptoDataDownload – Binance BTC/USDT Daily OHLCV vs Cboe U.S. Equities Historical Market Volume Data 2025