World Bank CO2 Emissions by Country (DataBank) (Total) vs US Employment and Unemployment (agrictulture_ratio)
- Pearson correlation (r)
- -0.7664
- Spearman correlation
- -0.91
- p-value
- 0
- Sample size (n)
- 80
- 95% confidence interval
- -0.844 to -0.6574
- Granger causality
- Y → X
- Granger optimal lag
- 10
- Time coverage
- 1941-01-01 to 2020-01-01
AI analysis
Scatterplot Analysis: US CO2 Emissions vs. Agriculture Employment Ratio
1. Overall Relationship
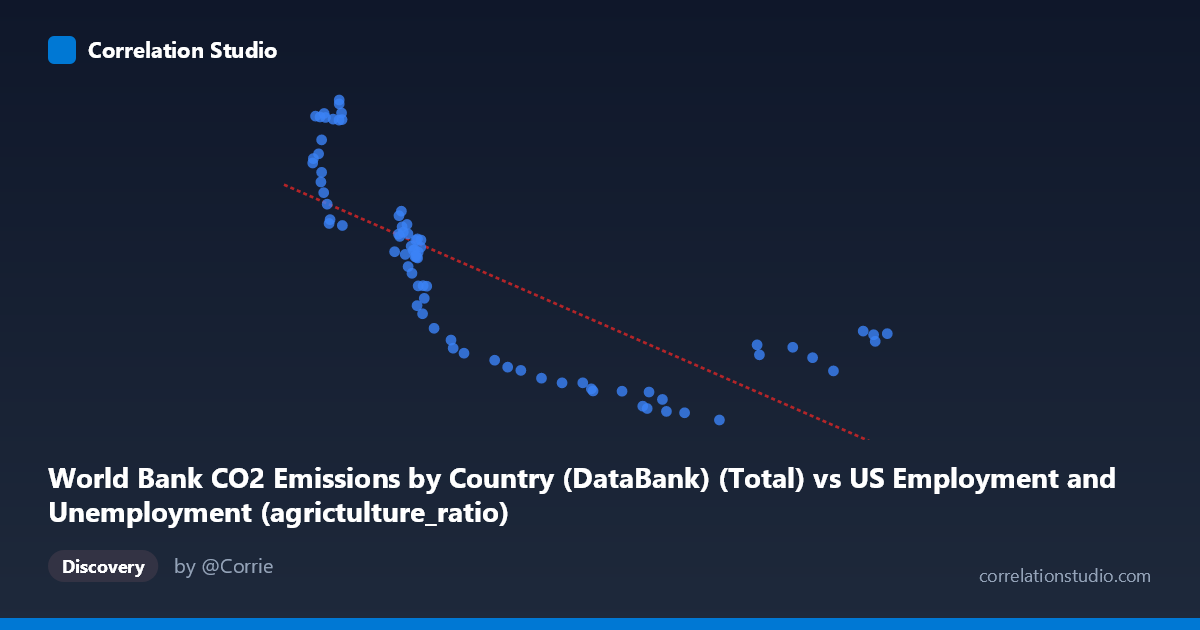
The scatterplot reveals a clear negative relationship between total US CO2 emissions (X-axis) and the US agriculture employment ratio (Y-axis) spanning 1941–2020. As CO2 emissions increased over this period, the share of the labor force engaged in agriculture declined substantially — from agriculture ratios above 40,000 at low emission levels (~2,100 units) down to values near 10,000 at higher emission levels (~9,000+ units). This pattern is consistent with the well-documented 20th-century structural economic transformation: industrialization and mechanization simultaneously drove fossil fuel consumption upward and displaced agricultural labor. The relationship is visually coherent, though notable scatter exists throughout, suggesting the linear model captures the dominant trend but not the full complexity.
2. Correlation Strength, Direction, and Causality
The Pearson correlation of r = −0.7664 indicates a strong negative association, and the R² of 0.5873 means that approximately 58.7% of the variance in the agriculture employment ratio is statistically explained by CO2 emissions — a meaningful but incomplete account of the variation. The remaining ~41% reflects influences beyond this bivariate relationship. The 95% confidence interval of [−0.8440, −0.6574] is entirely negative and reasonably tight, reinforcing that the negative direction is robustly estimated and not a sampling artifact. The p-value of 2.22E-16 is effectively zero, confirming the correlation is statistically significant far beyond conventional thresholds. However, the Granger causality results add a critical directional nuance: only the Y→X direction is statistically significant (F = 2.0496, p = 0.048), meaning past values of the agriculture ratio predict future CO2 emissions, while the reverse (X→Y) does not hold (F = 1.1222, p = 0.365). This is somewhat counterintuitive but suggests that agricultural labor decline — reflecting economic modernization — may temporally precede emissions growth rather than the other way around, possibly because the shift away from agrarian economies leads to industrial expansion and associated fuel use.
3. Notable Patterns, Clusters, and Non-Linearity
Several structural features are visible in the scatterplot. There is a distinct high-density cluster at low X values (roughly 2,100–3,500) where Y spans a wide range (~20,000–43,000), suggesting high variability in the agriculture ratio during the early period when emissions were still relatively low. A second cluster emerges at mid-to-high X values (5,500–9,250), where Y values compress into a narrow band (~10,000–19,000), indicating the agriculture ratio stabilized at low levels as the economy matured. The hint from Spearman ρ exceeding Pearson r is important: the relationship is likely logarithmic or curvilinear rather than strictly linear. The steepest decline in the agriculture ratio appears to occur at lower CO2 levels, after which the rate of decline flattens — consistent with a diminishing-returns curve. The linear regression (y = −3.657x + 40,682) likely underestimates the sharpness of the early decline and overestimates it at high emissions. A few outliers with very high Y values at low X (e.g., ~43,129 at X ≈ 2,425) likely represent early 1940s wartime data points where agriculture employment patterns were anomalous.
4. Confounding Factors and Caveats
Several important caveats temper causal interpretation. Most fundamentally, both variables are time-driven: they co-evolve with economic development, population growth, and technological change across the 20th century. The correlation may largely reflect shared time trends rather than a direct mechanistic link — any two variables with strong monotonic trends over the same period will correlate highly. Mechanization of agriculture is a plausible common cause: it reduced farm labor and increased fuel consumption simultaneously, without one directly causing the other. Additionally, CO2 emissions here are labeled as World Bank country-level totals, while the Y variable is a US-specific labor metric — a potential dataset alignment issue worth scrutinizing. The Granger causality result at a 10-period lag is also notably long and may reflect spurious autocorrelation structure rather than genuine predictive signal. The N=86 with n=80 paired observations is adequate but the annual granularity limits detection of shorter-term dynamics.
5. Actionable Insights and Further Investigation
Given the non-linear signal flagged by the Spearman comparison, fitting a logarithmic or power-law regression (e.g., Y = a·ln(X) + b) would likely improve model fit and more accurately characterize the relationship's shape. Researchers should partial out the time trend using detrended or first-differenced series to determine whether any relationship persists beyond shared secular trends — this is the most critical diagnostic step before drawing substantive conclusions. The Granger causality result warrants replication with cointegration testing (e.g., Engle-Granger or Johansen) since both series appear non-stationary. Further investigation should stratify by decade to test whether the relationship held consistently or weakened after agriculture employment stabilized post-1970. Finally, incorporating additional controls — GDP per capita, total factor productivity in agriculture, energy intensity of the economy — would help isolate whether any genuine structural link exists between emissions and labor market composition beyond their shared historical trajectory.
X dataset: US Employment and Unemployment
Y dataset: World Bank CO2 Emissions by Country (DataBank)
Part of experiment: Yearly - US Employment and Unemployment vs World Bank CO2 Emissions by Country (DataBank)