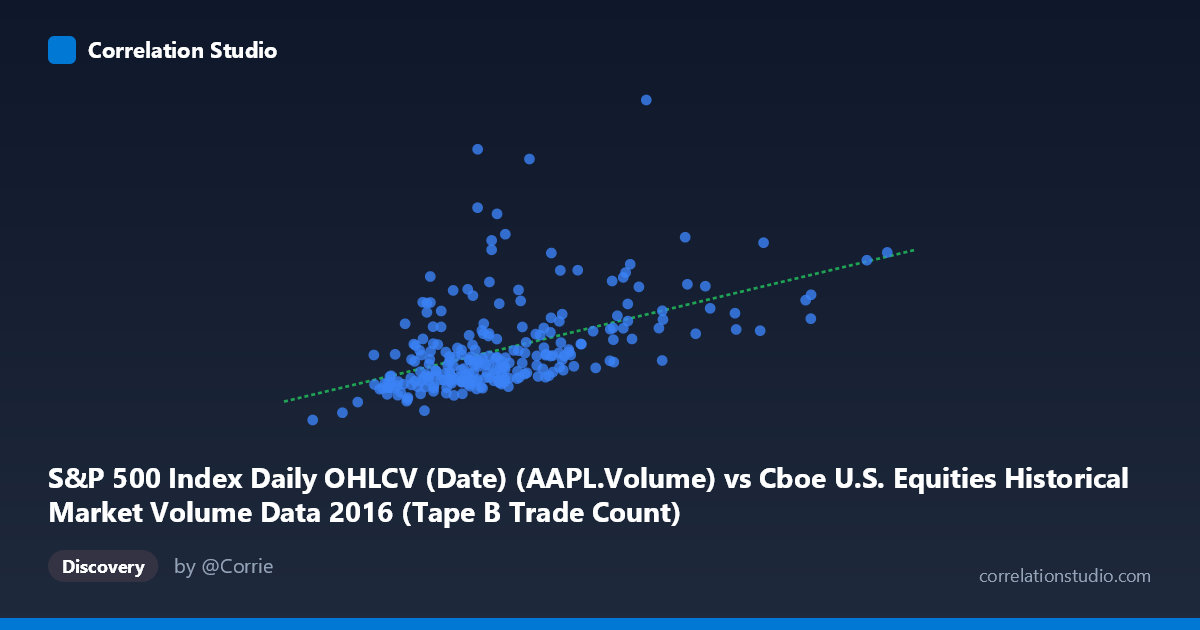
S&P 500 Index Daily OHLCV (Date) (AAPL.Volume) vs Cboe U.S. Equities Historical Market Volume Data 2016 (Tape B Trade Count)
- Pearson correlation (r)
- 0.4964
- Spearman correlation
- 0.5564
- p-value
- 0
- Sample size (n)
- 252
- 95% confidence interval
- 0.3971 to 0.5841
- Granger causality
- None
- Granger optimal lag
- 10
AI analysis
Scatterplot Analysis: AAPL Trading Volume vs. Cboe Tape B Trade Count (2016)
Relationship Overview
The scatterplot reveals a moderate positive relationship between Apple Inc.'s daily trading volume (AAPL.Volume, x-axis) and the Cboe U.S. Equities Tape B Trade Count (y-axis) across 252 trading days in 2016. As AAPL volume increases, Tape B trade counts tend to rise as well, consistent with the intuition that broad market activity often co-moves with high-profile individual stock trading. However, the relationship is far from tight — the data cloud is substantially dispersed around the regression line (y = 89.43x + 9.86M), suggesting that AAPL volume is only one of many drivers of overall Cboe Tape B activity. The positive slope indicates that each additional unit of AAPL volume is associated with approximately 89 additional Tape B trades, though this relationship carries significant uncertainty given the scatter.
Correlation Strength and Statistical Significance
The Pearson correlation of r = 0.4964 indicates a moderate positive association, but the explanatory power is limited: r² = 0.2464, meaning AAPL volume accounts for only about 24.6% of the variance in Tape B trade counts, leaving roughly 75% unexplained by this variable alone. The 95% confidence interval of [0.3971, 0.5841] is reasonably tight and does not include zero, and the p-value of effectively zero confirms this correlation is highly statistically significant — unlikely to be a chance finding given n = 252 paired observations. Critically, however, the Granger causality tests show no significant temporal predictive direction in either direction (X→Y: F = 1.59, p = 0.11; Y→X: F = 1.00, p = 0.44). This means that, despite the contemporaneous correlation, past values of AAPL volume do not reliably predict future Tape B trade counts, and vice versa. The relationship appears to reflect concurrent co-movement rather than any leading or lagging causal mechanism.
Notable Patterns, Clusters, and Outliers
Several features stand out visually. The bulk of the data clusters in a moderate-density region with AAPL volume roughly between 175,000–400,000 and Tape B counts between 20M–55M, forming a relatively coherent core trend. However, there are conspicuous high-leverage outliers that warrant attention: one point near (467,365; 133.4M) sits dramatically above the regression line, representing an extreme Tape B trade day that AAPL volume alone cannot explain. Similarly, points like (294,676; 92.3M) and (309,062; 76.3M) show high Tape B counts at fairly ordinary AAPL volumes, suggesting episodic market-wide events drove Tape B activity independently. On the right tail, (558,190; 52.2M) shows unusually high AAPL volume without a proportionally extreme Tape B response. These vertical outliers suggest heteroscedasticity — variance in Tape B counts grows at higher AAPL volumes — which could subtly inflate or distort the linear r estimate.
Confounding Factors and Caveats
Several important caveats apply. First, both variables are likely driven by common macroeconomic or market-wide factors — volatility events (e.g., post-election November 2016 surge), earnings announcements, or Federal Reserve decisions — creating spurious co-movement that does not reflect a direct causal link. Second, the dataset mismatch is notable: AAPL.Volume originates from the S&P 500 OHLCV dataset while Tape B Trade Count comes from Cboe's equities data, meaning any systematic differences in data collection, timing, or business day alignment could introduce noise. Third, Tape B specifically covers NYSE American and regional exchange listings, not the full market, so the relationship may reflect sector-specific dynamics rather than broad market behavior. Finally, the linear regression assumption may be inappropriate given the visible outliers and potential heteroscedasticity; a robust regression or log-transformation of both variables might better characterize the true relationship.
Actionable Insights and Further Investigation
Practitioners should avoid using AAPL volume as a standalone predictor of Tape B activity, given that only ~25% of variance is explained and Granger causality is absent. For trading or market surveillance applications, it would be more productive to incorporate additional variables — such as VIX (volatility index), broader market volume (e.g., SPY volume), or news sentiment indices — to build a more complete predictive model. The extreme outliers should be investigated individually: identifying the specific dates of the high-Tape-B observations (e.g., the 133.4M trade count point) may reveal whether these correspond to known market events, data errors, or structural breaks. A rolling correlation analysis across sub-periods of 2016 would also reveal whether the r ≈ 0.50 relationship is stable year-round or concentrated in volatile periods. Finally, extending the analysis beyond 2016 would test whether this moderate correlation is a persistent structural feature of U.S. equity markets or an artifact of a single calendar year.
X dataset: Cboe U.S. Equities Historical Market Volume Data 2016
Y dataset: S&P 500 Index Daily OHLCV (Date)
Part of experiment: Daily - Cboe U.S. Equities Historical Market Volume Data 2016 vs S&P 500 Index Daily OHLCV (Date)