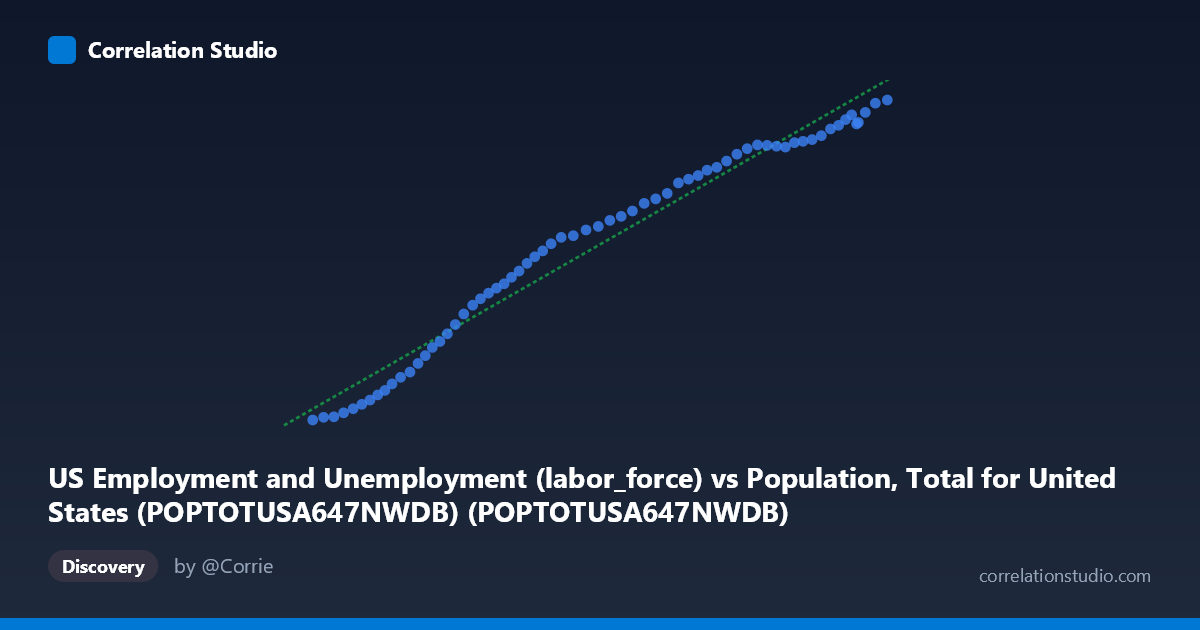
US Employment and Unemployment (labor_force) vs Population, Total for United States (POPTOTUSA647NWDB) (POPTOTUSA647NWDB)
- Pearson correlation (r)
- 0.9851
- Spearman correlation
- 0.9992
- p-value
- 0
- Sample size (n)
- 65
- 95% confidence interval
- 0.9757 to 0.9909
- Granger causality
- None
- Granger optimal lag
- 10
AI analysis
Analysis: US Total Population vs. Labor Force Size (1960–2024)
1. Relationship Overview
The scatterplot reveals a remarkably tight, positive linear relationship between total US population and the size of the labor force over the 1960–2024 period. As population grows, labor force size increases proportionally and consistently, with data points clustering very closely around the fitted regression line (y = 0.00063505x − 41,703.2). This near-perfect alignment across six decades of data suggests that labor force growth has tracked population growth with unusual consistency, reflecting the structural demographic expansion of the United States rather than any episodic or policy-driven phenomenon.
2. Correlation Strength and Statistical Interpretation
The correlation is exceptionally strong (r = 0.9851), and the coefficient of determination (r² = 0.9705) indicates that 97.1% of the variance in labor force size is explained by total population alone. This is a remarkably high figure for real-world socioeconomic data. The 95% confidence interval [0.9757, 0.9909] is narrow and lies entirely at the high end of the correlation scale, confirming that this result is highly stable and not an artifact of sampling variability. The p-value of effectively zero confirms statistical significance beyond any reasonable threshold. However, despite this extraordinary statistical association, the Granger causality tests reveal no significant temporal predictive direction in either direction — neither X→Y (F = 1.16, p = 0.35) nor Y→X (F = 1.03, p = 0.44) — at the optimal lag of 10 periods. This is a critical nuance: while the two series are tightly correlated contemporaneously, neither variable meaningfully predicts the other's future values, suggesting they are co-moving driven by a shared underlying process rather than one causing the other.
3. Notable Patterns, Clusters, and Features
The data points form a nearly unbroken linear continuum from the lower-left (early 1960s, ~181M population, ~70K labor force) to the upper-right (2024, ~340M population, ~168K labor force), with no dramatic outliers or breaks. There is a slight visual suggestion of a marginal flattening or compression at the upper end of the distribution, where the most recent data points (population 310M) appear marginally denser and possibly slightly below what a strict linear extrapolation might predict — potentially reflecting slower labor force participation rate growth or demographic aging in the post-2000 era. No single point stands dramatically apart from the trend, which is itself notable across such a long time horizon encompassing recessions, booms, and demographic shifts.
4. Confounding Factors and Interpretive Caveats
The most important caveat is that this correlation largely reflects the passage of time — both variables increase monotonically over decades, making spurious correlation almost inevitable for any two growing time series. The Granger causality failure reinforces this: the relationship is driven by a shared time trend, not a structural causal mechanism. Key confounders include: (a) labor force participation rate changes (the proportion of population that works has fluctuated significantly, especially with women's entry into the workforce through the 1970s–1990s and subsequent decline post-2000); (b) demographic aging, as Baby Boomer retirement suppresses labor force growth relative to population; (c) immigration patterns, which simultaneously affect both variables; and (d) the use of annual data at the population scale which smooths over business-cycle dynamics. The units also warrant attention — labor force figures appear to be in thousands while population is in raw units, meaning the slope coefficient (0.000635) implies roughly 63.5 workers per 100 additional residents, a plausible but time-varying labor force participation rate.
5. Actionable Insights and Further Investigation
Rather than treating population as a predictor of labor force size, analysts should investigate the labor force participation rate (labor force ÷ population) as the more informative dependent variable — one that would reveal whether the US is becoming more or less work-intensive over time. Further investigation should include: (1) segmenting the data by era (pre/post-1990, pre/post-2008 financial crisis, pre/post-COVID) to test whether the linear relationship holds across sub-periods or masks structural breaks; (2) introducing age-structure controls (working-age population 16–64 vs. total population) to better isolate demographic effects; (3) applying cointegration testing (e.g., Engle-Granger or Johansen) rather than Granger causality to properly assess the long-run equilibrium relationship between two non-stationary series; and (4) comparing the US trajectory against peer nations to assess whether this tight population-labor force link is universal or specific to US demographic and policy conditions.
X dataset: Population, Total for United States (POPTOTUSA647NWDB)
Y dataset: US Employment and Unemployment
Part of experiment: Yearly - Population, Total for United States (POPTOTUSA647NWDB) vs US Employment and Unemployment