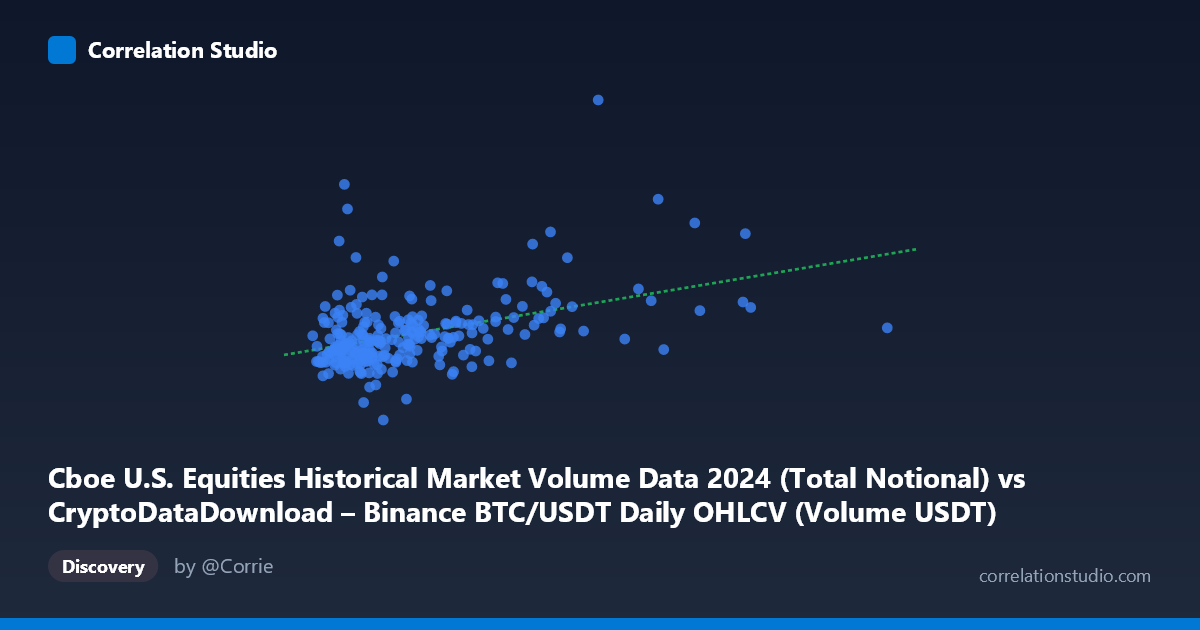
Cboe U.S. Equities Historical Market Volume Data 2024 (Total Notional) vs CryptoDataDownload – Binance BTC/USDT Daily OHLCV (Volume USDT)
- Pearson correlation (r)
- 0.4213
- Spearman correlation
- 0.3854
- p-value
- 0
- Sample size (n)
- 252
- 95% confidence interval
- 0.3141 to 0.518
- Granger causality
- None
- Granger optimal lag
- 10
- Time coverage
- 2024-01-02 to 2024-12-31
AI analysis
Analysis: Cboe U.S. Equities Volume vs. Binance BTC/USDT Volume (2024)
1. Relationship Overview
The scatterplot shows a weak-to-moderate positive relationship between Cboe U.S. equities notional volume (X) and Binance BTC/USDT trading volume (Y). Most data points cluster tightly in the lower-left region (X < 4B, Y between 20B–40B), with a long right-tail of higher-X observations that pull the trend line upward. The relationship is far from a clean linear pattern — it looks more like a dense core cloud with scattered high-leverage points extending the range.
2. Strength, Direction, and Statistical Significance
The correlation coefficient (r = 0.421) indicates a modest positive association, and r² = 0.178 tells us that only about 17.8% of the variance in BTC volume is explained by equities volume — leaving over 80% attributable to other factors. The 95% CI [0.314, 0.518] is reasonably tight and excludes zero, and the p-value (2.88E-12) confirms this correlation is statistically significant and not due to chance, given n = 252. However, statistical significance here reflects sample size more than practical strength — an r² under 0.2 means the relationship has limited predictive/explanatory power on its own.
Critically, the Granger causality tests show no significant predictive direction in either direction (X→Y: p = 0.688; Y→X: p = 0.628, at 10 lags). This means neither market's volume systematically leads the other in time — the contemporaneous correlation is not evidence of one market driving the other. This is an important distinction: the variables move together somewhat, but not in a way that lets you use one to forecast the other.
3. Notable Patterns and Outliers
Several features stand out: - A dense core cluster at low-to-moderate X (roughly 1B–3.5B) with Y values spanning 20B–40B — this is where most days fall, and within this cluster the correlation appears weak/noisy. - High-leverage outliers at large X values (6.7B, 8.6B, 11B) that likely disproportionately drive the positive slope; without them, the correlation may be considerably weaker. - A vertical outlier near X ≈ 2.29B with Y ≈ 16.4B (the dataset minimum) — a day of unusually low BTC volume despite typical equities volume. - A spike outlier near X ≈ 1.67B with Y ≈ 54.6B — very high BTC volume paired with low equities volume, contradicting the general trend. - No obvious non-linear curvature (e.g., saturation or threshold effects) is apparent; the scatter looks like linear noise with a few influential points rather than a curved relationship.
4. Confounding Factors and Caveats
Both series are volume metrics from different, largely unrelated markets (traditional U.S. equities vs. crypto), so any correlation is more likely driven by shared macro conditions than direct causal linkage. Candidate confounders include: - Overall market volatility regimes (e.g., macro news, Fed decisions, risk-on/risk-off days) that simultaneously boost trading activity across asset classes. - Calendar effects — both equities and crypto volumes may spike around month-end, quarter-end, options expiration, or major economic releases, creating spurious correlation without direct linkage. - Trend/seasonality in 2024 — both series may have independent upward or event-driven trends over the year (e.g., BTC ETF approval in January, halving in April) that create correlation through shared time-trend rather than genuine interaction. - Outlier sensitivity — with only 252 points and a few extreme values, r and the regression slope could be unduly influenced by a handful of days.
5. Suggested Next Steps
- Detrend or difference both series before correlating, to remove shared calendar/trend effects and isolate genuine co-movement. - Robust/rank correlation (Spearman) and outlier-excluded reruns to check whether the r = 0.42 result is driven by the handful of high-leverage points identified above. - Event-based analysis: flag known 2024 catalysts (ETF approvals, halving, FOMC dates) and test whether correlation strengthens specifically around these shared-shock days. - Given the null Granger result, avoid using this relationship for cross-market forecasting; instead, treat any co-movement as coincident/contemporaneous rather than predictive. - Consider adding a third variable (e.g., a volatility index like VIX or a crypto fear/greed index) as a common driver to test whether it better explains the shared variance than a direct X–Y relationship.
X dataset: CryptoDataDownload – Binance BTC/USDT Daily OHLCV
Y dataset: Cboe U.S. Equities Historical Market Volume Data 2024
Part of experiment: Bitcoin - CryptoDataDownload – Binance BTC/USDT Daily OHLCV vs Cboe U.S. Equities Historical Market Volume Data 2024