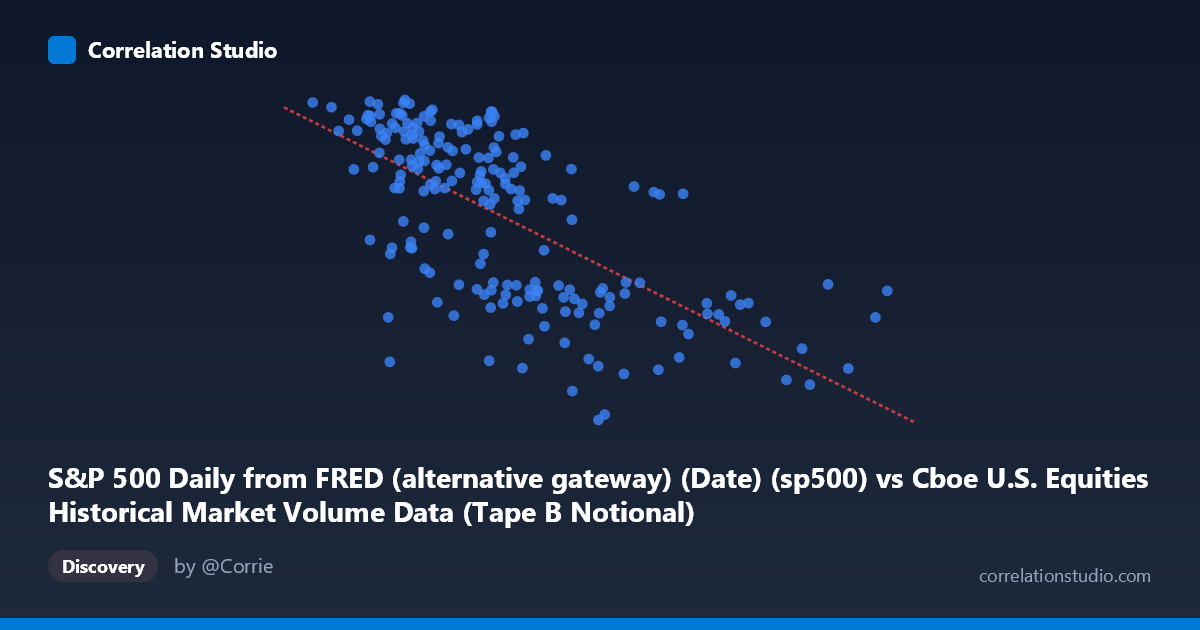
S&P 500 Daily from FRED (alternative gateway) (Date) (sp500) vs Cboe U.S. Equities Historical Market Volume Data (Tape B Notional)
- Pearson correlation (r)
- -0.6701
- Spearman correlation
- -0.7013
- p-value
- 0
- Sample size (n)
- 195
- 95% confidence interval
- -0.7409 to -0.5847
- Granger causality
- None
- Granger optimal lag
- 10
AI analysis
Scatterplot Analysis: S&P 500 Date Values vs. Tape B Notional Volume
Relationship Overview
The scatterplot reveals a moderate negative relationship between the S&P 500 date index (used here as a sequential time variable measured in Unix-style epoch milliseconds) and Cboe Tape B Notional trading volume. As the date advances from early January 2026 through late May 2026, Tape B Notional volume shows a general downward trend, suggesting that notional trading activity on Tape B exchanges declined over this roughly five-month observation window. The linear regression equation (y = −4.28×10⁻⁸x + 7,463.1) captures this negative slope, though the relationship is far from deterministic, with substantial vertical scatter visible throughout the date range.
Correlation Strength and Statistical Significance
The Pearson correlation of r = −0.54 indicates a moderate negative association, but the explained variance tells a more sobering story: r² = 0.291, meaning only about 29% of the variance in Tape B Notional volume is accounted for by the date/time dimension alone. The remaining ~71% of variation is driven by factors outside this simple linear model. The 95% confidence interval of [−0.667, −0.382] is meaningfully wide, reflecting the sample size of n = 98, yet the entire interval sits firmly in negative territory and the p-value of 9.78×10⁻⁹ confirms the correlation is highly statistically significant — the negative trend is not a sampling artifact. Critically, however, Granger causality tests in both directions fail to reach significance (X→Y: F = 0.856, p = 0.578; Y→X: F = 1.037, p = 0.423), meaning neither variable reliably predicts the other temporally at any tested lag up to 10 periods. The correlation reflects co-movement with time rather than any dynamic predictive relationship between the series.
Notable Patterns, Clusters, and Outliers
Several features stand out beyond the overall downward trend. The left portion of the chart (earlier dates, roughly corresponding to January–February 2026) displays notably higher and more dispersed Tape B Notional values, including several elevated readings above 7,400 (e.g., 7,501, 7,473, 7,445, 7,433). These may reflect elevated early-year trading activity. The middle range of dates shows a dense cluster near the mean (~6,900–6,960), indicating relatively stable but lower notional volume. A handful of conspicuous low-volume outliers appear scattered across dates — notably values of 6,343.72, 6,368.85, 6,477.16, and 6,506.48 — which deviate substantially below the main cluster and could represent data anomalies, settlement days, or genuine market disruptions. The far right of the chart (late dates, ~April–May 2026) shows one anomalously high reading near 6,939 paired with a very large date value, suggesting the trend may not be monotonically declining at the tail end.
Confounding Factors and Interpretive Caveats
The most important caveat is that the X-axis encodes dates as raw numeric timestamps, making this correlation essentially a time-trend analysis rather than a meaningful causal variable pairing. Any variable with a time trend over this period would show a similar correlation. Tape B Notional volume could be declining due to market seasonality, shifts in trading behavior toward Tape A or C venues, changes in market volatility (which often drives notional volumes), regulatory changes, or simply mean reversion after elevated January activity. Furthermore, the dataset spans only ~5 months of 2026, so the observed trend may not generalize beyond this window. The Granger causality failure reinforces that whatever is driving volume changes, it is not captured by lagged date values or lagged volume itself in any predictively useful way.
Actionable Insights and Further Investigation
Given that ~71% of Tape B Notional variance remains unexplained, investigators should consider incorporating VIX or realized volatility as covariates, since notional volume is strongly theoretically linked to volatility regimes. Decomposing the data by Tape A and Tape C alongside Tape B would reveal whether the decline is venue-specific or market-wide. The outlier observations (particularly the sub-6,500 readings) warrant individual-date investigation to determine whether they represent data quality issues or genuine market events. Finally, extending the analysis to a multi-year horizon using the full FRED S&P 500 series and Cboe historical files would allow separation of cyclical from structural trends and provide far more statistical power to detect genuine predictive relationships.
X dataset: Cboe U.S. Equities Historical Market Volume Data
Y dataset: S&P 500 Daily from FRED (alternative gateway) (Date)
Part of experiment: Daily - Cboe U.S. Equities Historical Market Volume Data vs S&P 500 Daily from FRED (alternative gateway) (Date)