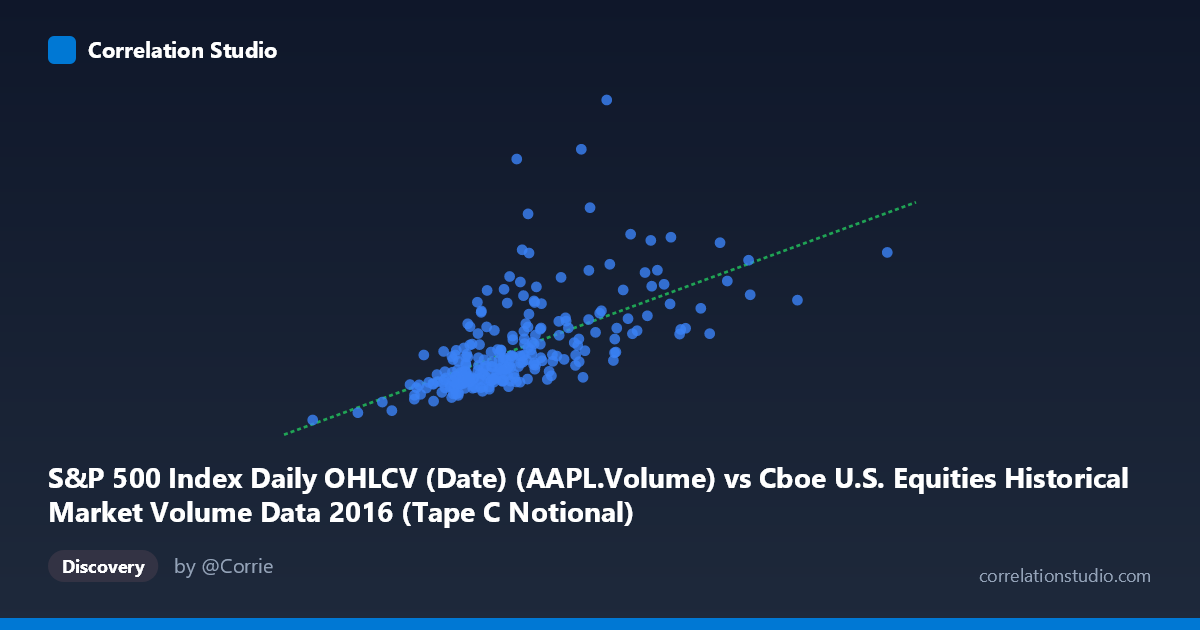
S&P 500 Index Daily OHLCV (Date) (AAPL.Volume) vs Cboe U.S. Equities Historical Market Volume Data 2016 (Tape C Notional)
- Pearson correlation (r)
- 0.6166
- Spearman correlation
- 0.7144
- p-value
- 0
- Sample size (n)
- 252
- 95% confidence interval
- 0.5337 to 0.6878
- Granger causality
- None
- Granger optimal lag
- 10
AI analysis
Scatterplot Analysis: AAPL Trading Volume vs. Cboe Tape C Notional Value (2016)
1. Overall Relationship The scatterplot reveals a moderate positive relationship between Apple Inc.'s daily trading volume (S&P 500 OHLCV dataset) and Cboe's Tape C notional trading value across 252 paired trading days in 2016. As AAPL volume increases, Tape C notional value tends to rise as well, consistent with the upward-sloping linear regression line (y = 0.00924x − 7.64M). The relationship is broadly coherent — both variables reflect equity market activity — but the scatter around the regression line is substantial, indicating the relationship is real but far from deterministic.
2. Correlation Strength and Statistical Significance The Pearson correlation of r = 0.6166 indicates a moderate positive association. However, the R² of 0.3803 is the more sobering metric: AAPL volume explains only 38% of the variance in Tape C notional value, leaving 62% attributable to other factors. The 95% confidence interval of [0.534, 0.688] is reasonably tight and lies entirely above zero, and the p-value of effectively 0 confirms this correlation is highly unlikely to be a chance artifact across n = 252 paired observations. That said, statistical significance should not be mistaken for practical or causal significance. Critically, the Granger causality tests find no significant predictive directionality in either direction (X→Y: F = 1.00, p = 0.44; Y→X: F = 1.29, p = 0.24), meaning that past AAPL volume does not reliably predict future Tape C notional values, nor vice versa — the correlation is contemporaneous rather than temporally predictive.
3. Notable Patterns, Clusters, and Outliers The bulk of observations cluster in a relatively compressed region — AAPL volumes between roughly 3.9B and 5.5B and Tape C notional values between 20M and 55M — suggesting stable "normal market" trading conditions dominate the year. However, several notable outliers deserve attention. A data point near (6.35B, 133.4M) stands dramatically above the regression line and represents the most extreme outlier in the dataset, likely corresponding to a high-volatility event (e.g., earnings release or macroeconomic shock). Similarly, points near (6.1B, 92.3M) and (6.7B, 82.2M) form a loose high-volume, high-notional cluster in the upper right. At the other extreme, low-volume days (AAPL ~3.4B–3.5B) consistently show low Tape C notional values, reinforcing the positive trend but also highlighting that the relationship strengthens at market extremes.
4. Confounding Factors and Interpretive Caveats Several important caveats apply. First, AAPL is a single stock within Tape C (NYSE Arca/regional exchanges), and while it is a heavily weighted component, Tape C notional value reflects thousands of securities — the correlation partly reflects AAPL's sheer market dominance rather than a structural causal link. Second, common-cause confounding is likely: broad market volatility events (Fed announcements, election uncertainty in 2016, Brexit aftermath) would simultaneously inflate both AAPL volume and overall Tape C notional, creating a spurious appearance of direct linkage. Third, the dataset axis labels appear swapped relative to their source descriptions (AAPL Volume is labeled as coming from one dataset, Tape C Notional from another), which warrants verification before drawing operational conclusions. Finally, the linear model may be misspecified — the outlier cluster suggests the relationship may be heteroscedastic or better modeled with a nonlinear form at high-volume regimes.
5. Actionable Insights and Further Investigation Practitioners should avoid using AAPL volume alone as a predictor of Tape C notional activity given the lack of Granger causality and the 62% unexplained variance. More productive next steps would include: (a) incorporating a broader basket of high-cap Tape C constituents (e.g., Google, Meta) to build a more robust volume-notional predictive model; (b) segmenting the data by volatility regime (e.g., VIX quartiles) to test whether the correlation strengthens during stress periods, as the outlier pattern suggests; (c) applying a log-log transformation to address potential heteroscedasticity and better capture the relationship at extremes; and (d) investigating the extreme outlier near (6.35B, 133.4M) by cross-referencing the specific date against AAPL corporate events or macro catalysts to understand whether it represents a systematic or idiosyncratic phenomenon.
X dataset: Cboe U.S. Equities Historical Market Volume Data 2016
Y dataset: S&P 500 Index Daily OHLCV (Date)
Part of experiment: Daily - Cboe U.S. Equities Historical Market Volume Data 2016 vs S&P 500 Index Daily OHLCV (Date)