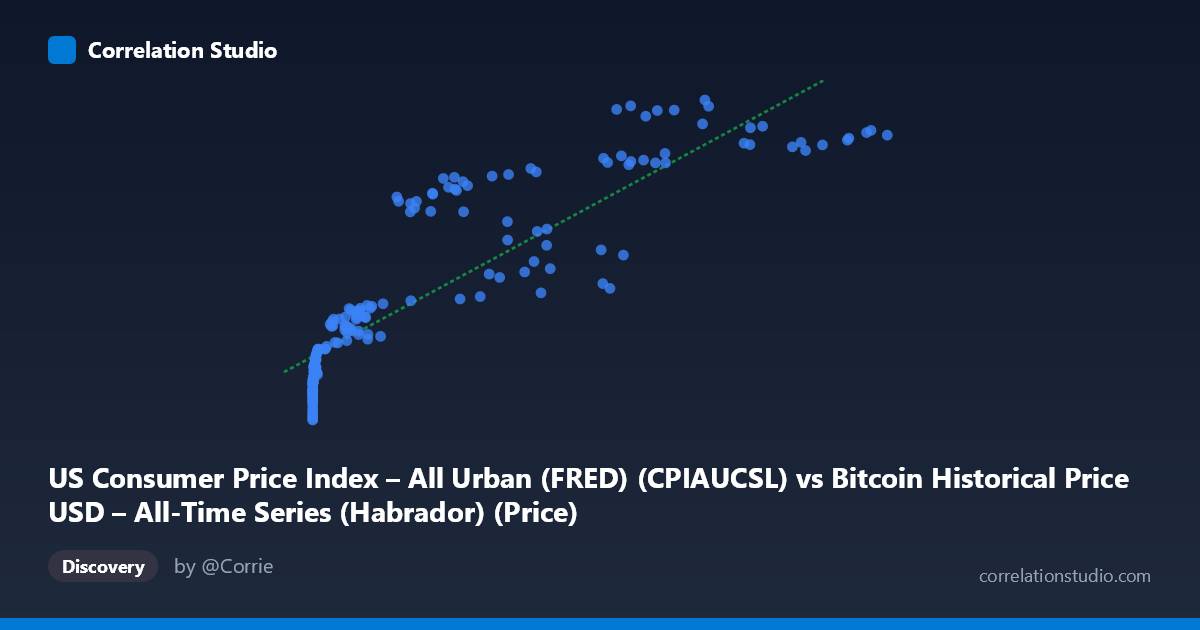
US Consumer Price Index – All Urban (FRED) (CPIAUCSL) vs Bitcoin Historical Price USD – All-Time Series (Habrador) (Price)
- Pearson correlation (r)
- 0.8831
- Spearman correlation
- 0.9736
- p-value
- 0
- Sample size (n)
- 193
- 95% confidence interval
- 0.8476 to 0.9108
- Granger causality
- None
- Granger optimal lag
- 1
- Time coverage
- 2010-08-01 to 2026-09-01
- Recomputed on refreshed data
- 2026-10-24 (r was 0.875)
AI analysis
Analysis: Bitcoin Price vs. US CPI (2010–2026)
1. What the Visualization Reveals
The scatterplot shows a strong positive association between Bitcoin's USD price and the US Consumer Price Index over roughly a 15-year span. However, the relationship is clearly non-linear — the data forms a curve rather than a straight line. At low Bitcoin prices (under ~$1,000), CPI values cluster tightly in the 218–245 range with very little spread. As Bitcoin prices climb into the tens of thousands, CPI values rise more steeply and with greater dispersion (e.g., $58,724 → CPI 266.6 alongside $57,454 → CPI 314.7). This pattern is consistent with a logarithmic or power-law relationship, which is expected given Bitcoin's exponential price growth compared to CPI's steady, near-linear inflation trajectory.
2. Strength, Direction, and Uncertainty
The correlation coefficient (r = 0.875) indicates a strong positive linear relationship, with r² = 0.766 meaning the linear model explains about 77% of the variance in CPI using Bitcoin price as a predictor. The 95% confidence interval [0.837, 0.905] is tight and the p-value is effectively zero, indicating this correlation is highly statistically reliable given the sample — not a product of chance. However, statistical significance and strength of correlation should not be conflated with causation. The Granger causality tests confirm this: neither direction (Bitcoin→CPI or CPI→Bitcoin) shows significant predictive power (p = 0.197 and p = 0.220, respectively, at 2 lags). This means that despite the strong contemporaneous correlation, past values of one series do not meaningfully help forecast future values of the other. Practically, this tells us the relationship is likely driven by both variables trending upward over the same calendar period rather than one causing or leading the other.
3. Notable Patterns and Outliers
The most striking feature is the heteroscedasticity — variance in CPI increases substantially as Bitcoin price increases. At low Bitcoin values, CPI is nearly constant (a tight horizontal band), but at high Bitcoin values, CPI spans a much wider range (e.g., $60,000–$106,000 corresponds to CPI values from 266 to 330). This suggests Bitcoin's price is far more volatile than CPI, and multiple Bitcoin price levels can co-occur with similar CPI readings during volatile bull/bear cycles. There's also a subtle "plateau" cluster around $85,000–$106,000 where CPI is bunched in the 314–322 range, suggesting a period (likely 2024–2025) where CPI grew slowly while Bitcoin price surged and later consolidated — a possible bubble/correction phase.
4. Confounding Factors and Caveats
This is a classic case of spurious correlation via shared time trend. Both series are non-stationary and trend upward over the observation window for entirely independent reasons: CPI rises due to structural monetary inflation, while Bitcoin's price rise reflects speculative demand, adoption cycles, and market sentiment. Any two upward-trending time series will show high correlation without any causal link. Additional confounders include: macroeconomic regime shifts (COVID-era stimulus, rate hikes), Bitcoin-specific halving cycles, and the fact that both series were sampled monthly, inflating apparent smoothness and correlation. The lack of Granger causality strongly reinforces that this is a "third variable" (time/macro conditions) driving both, not a direct economic linkage.
5. Actionable Insights and Further Investigation
- Do not treat CPI as a predictive input for Bitcoin price models (or vice versa) — the Granger test results argue against using this relationship for forecasting. - Detrend both series (e.g., via first differencing, log returns, or removing time trend) and recheck correlation. If correlation collapses after detrending, it confirms the relationship is spurious/trend-driven rather than fundamental. - Test a log-log or log-linear model given the visible non-linearity — regressing log(Bitcoin price) against CPI may yield a more interpretable, better-fitting model than the current linear fit. - Introduce lagged macro variables (interest rates, M2 money supply, DXY index) to disentangle whether Bitcoin's price co-moves with broader inflation-driven asset appreciation rather than CPI specifically. - Segment analysis by market cycle (bull vs. bear phases) to assess whether the correlation strength changes across regimes, which would refine risk models for portfolios using both assets.
X dataset: Bitcoin Historical Price USD – All-Time Series (Habrador)
Y dataset: US Consumer Price Index – All Urban (FRED)
Part of experiment: Bitcoin - Bitcoin Historical Price USD – All-Time Series (Habrador) vs US Consumer Price Index – All Urban (FRED)